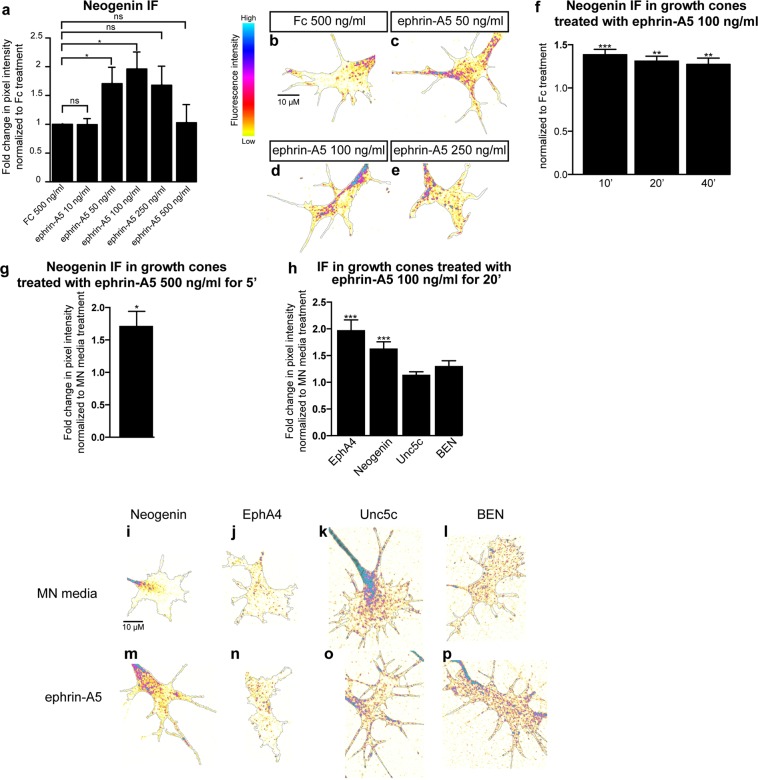
Figure 2.
Ephrin-A5 increases Neogenin and EphA4 protein levels in LMC growth cones. (a) Mean Neogenin IF in LMC explants treated 15′ with either a control solution containing Fc at 500 ng/mL or ephrin-A5 at concentrations ranging from 10 to 500 ng/mL. Ephrin-A5 at 50 and 100 ng/mL results in increased levels of Neogenin IF (ephrin-A5 50 ng/mL: 1.7 ± 0.3-fold, p = 0.038; ephrin-A5 100 ng/mL: 2 ± 0.3-fold, p = 0.011). (b–e) Examples of Neogenin IF in growth cones quantified in (a). (f) Mean Neogenin IF in growth cones of LMC explants treated with either Fc or ephrin-A5 at 100 ng/mL for 10′ 20′ and 40′. A 10′ exposure to ephrin-A5 is sufficient to increase Neogenin IF (1.4 ± 0.1-fold, p = 0.0007) and the increase is maintained after 20′and 40′ (1.3 ± 0.1-fold, p = 0.0017; 1.3 ± 0.1-fold, p = 0.0095 respectively). (g) A 5′ exposure to ephrin-A5 at 100 ng/mL is sufficient for increasing the mean Neogenin IF in LMC growth cones (1.7 ± 0.2-fold, p = 0.0228). (h) Quantification of mean Neogenin, EphA4, Unc5c and BEN IF levels in growth cones exposed to either MN media or ephrin-A5 at 100 ng/mL for 20′. Ephrin-A5 induced an increase in Neogenin and EphA4 IF (1.6 ± 0.1-fold, p < 0.0001; 2 ± 0.2-fold, p = 0.0001 respectively), Unc5c and BEN IF levels did not significantly differ (p = 0.0806 and p = 0.1391 respectively). (i,p) Examples of growth cones quantified in (h). Data are shown as mean ± SEM, statistical significance was tested using a two-tailed unpaired sample t-test. (a) Fc 500 ng/mL N = 5, ephrin-A5 10 ng/mL N = 3, eprhrin-A5 50 ng/mL N = 5, ephrin-A5 100 ng/mL N = 5, ephrin-A5 250 ng/mL N = 5, ephrin-A5 500 ng/mL N = 3; (f) Fc 100 ng/mL 40′ N = 4,ephrin-A5 100 ng/mL 10′ N = 4, ephrin-A5 100 ng/mL 20′ N = 4, ephrin-A5 100 ng/mL 40′ N = 4; (g) Fc 500 ng/mL 5′ N = 4, ephrin-A5 500 ng/mL 5′ N = 4; n: EphA4 N = 16, Neogenin N = 13, BEN N = 5, Unc5c N = 10. Values for the total number of growth cones and SEM values for each treatment for this figure and subsequent figures are provided in the Supplementary Excel File.

