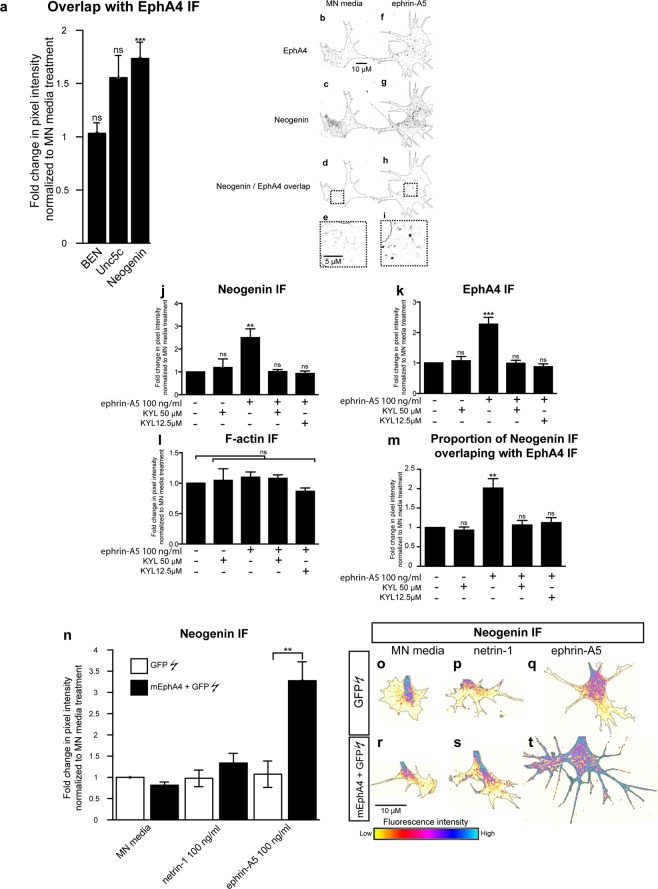
Figure 6.
Involvement of EphA4 in the ephrin-A5-induced increase in Neogenin IF. (a) Quantification of the proportion of Neogenin, Unc5c and BEN IF overlap with EphA4 IF in thresholded images of growth cones that were treated for 20′ with MN media ephrin-A5 at 100 ng/mL. Ephrin-A5 treatment resulted in a 1.7 ± 0.2 -fold increase in the proportion of Neogenin/EphA4 IF overlap (p = 0.0007) without significantly altering Unc5c/EphA4 or BEN/EphA4 IF overlap (p = 0.088 and p = 0.453 respectively). (b,i) Examples of thresholded images of growth cones immunostained for EphA4 (b,f) and Neogenin (c,g) and treated with MN media (b–e) or ephrin-A5 (e–i). Panels (d,h) show the resulting overlap in Neogenin/EphA4 signal in MN media and ephrin-A5 treated explants respectively, panels (e,i) are magnified images of boxed regions in (d,h). (j–m) LMC explants were incubated with either MN media, KYL 12.5 µM or KYL 50 µM for 20′ prior to being treated with either MN media or ephrin-A5 at 100 ng/mL for 20′ followed by Neogenin, EphA4 and F-actin immunostaining. (j–l) Quantification of Neogenin (j), EphA4 (k) or F-actin (l) IF in growth cones normalized to MN media treatment. (m) Quantification of the proportion of Neogenin IF overlapping with EphA4 IF normalized to MN media treatment. (j) **p = 0.0034, (k) ***p = 0.0003, (m) **p = 0.0085. (n–t) LMC explants from chick spinal cords electroporated with either a GFP expression plasmid alone or in combination with a mEphA4 expression plasmid were subject to a 20′ treatment of either MN media, netrin-1 or ephrin-A5 at 100 ng/mL.(n) Quantification of Neogenin IF in growth cones shows that in explants treated with ephrin-A5 and overexpressing EphA4, Neogenin levels in growth cones are 3.3 ± 0.3-fold higher than in explants expressing GFP alone (**p = 0.0022). (o–t) Examples of Neogenin IF in growth cones quantified in (n). Data are shown as mean ± SEM, statistical significance was tested using a two-tailed unpaired sample t-test. The number of experiments and growth cones for each treatment are in the Supplementary Excel File.

