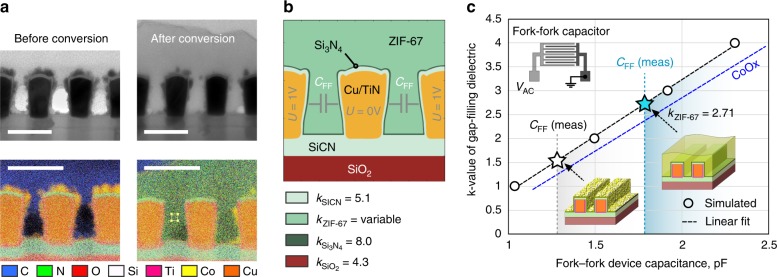
Fig. 4.
Imaging and electrical evaluation of 45 nm half-pitch fork–fork capacitors with oxidized CVD Co layer before and after the conversion reaction. a TEM images and EDS elemental maps recorded on lamella cut out from the capacitor device, scalebar is 100 nm. b A 2D model of the device cross-section employed for finite-element capacitance (CFF) simulation. c k-value determination of the gap-filling ZIF-67 phase. The black curve represents capacitance simulation data based on the TEM cross-sections in the absence of defects in the gap-filling layer. The blue curve corresponds to similar simulations assuming the worst-case scenario of 20 nm CoOx particles in the gap-filling phase

