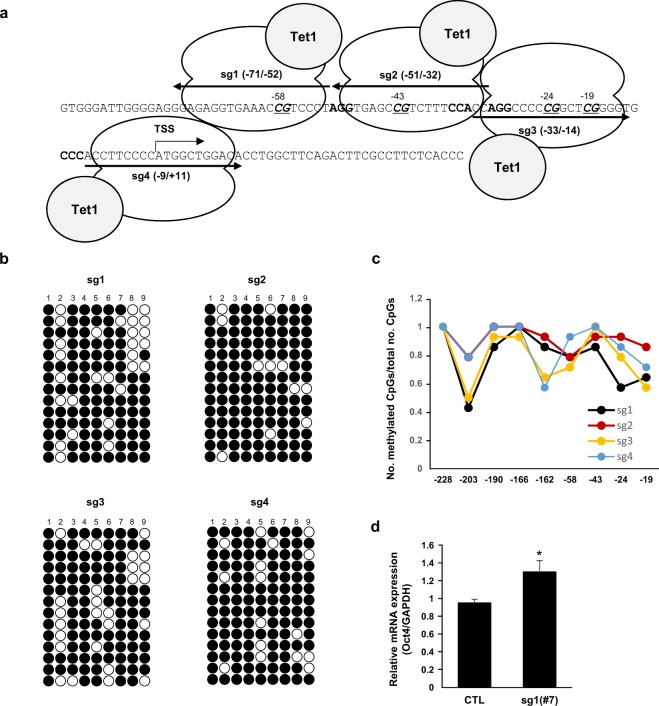
Figure 4.
sgRNA/dCas9-Tet1 system was designed for the demethylation of the Oct4 promoter. (a) Schematic for the sgRNA/dCas9-Tet1 modules targeting the Oct4 promoter. Italic and bold letters indicate the CpG sites and PAM sequences for each module, respectively. Corresponding sequences for each sgRNA were identical to Fig. 1. (b) The sequence −228 to −19 from TSS of the Oct4 promoter was analyzed by bisulfite sequencing. Fourteen clones per sample were sequenced and the sequence results are shown in the dot plot. The horizontal line represents the sequencing result of one clone, and the vertical line represents each individual CpG sites. The numbers (1–9) on top indicate the −228, −203, −190, −166, −162, −58, −43, −24, and −19 sites sequentially. The open and closed circles represent unmethylated and methylated CpG sites, respectively. (c) The graphs show the rate of methylated CpGs (y-axis) for the different sites along the Oct4 promoter (x-axis) based on the result of b. (d) mRNA levels of Oct4 from NIH3T3 cells and sgRNA1/dCas9-Tet1 stable expressing NIH3T3 cells were measured by qRT-PCR. The Oct4 mRNA level was normalized to that of GAPDH. Data are presented as the mean ± standard deviation from at least three independent experiments. Statistically significant differences were determined by a two-tailed Student’s t-test (*P < 0.05).

