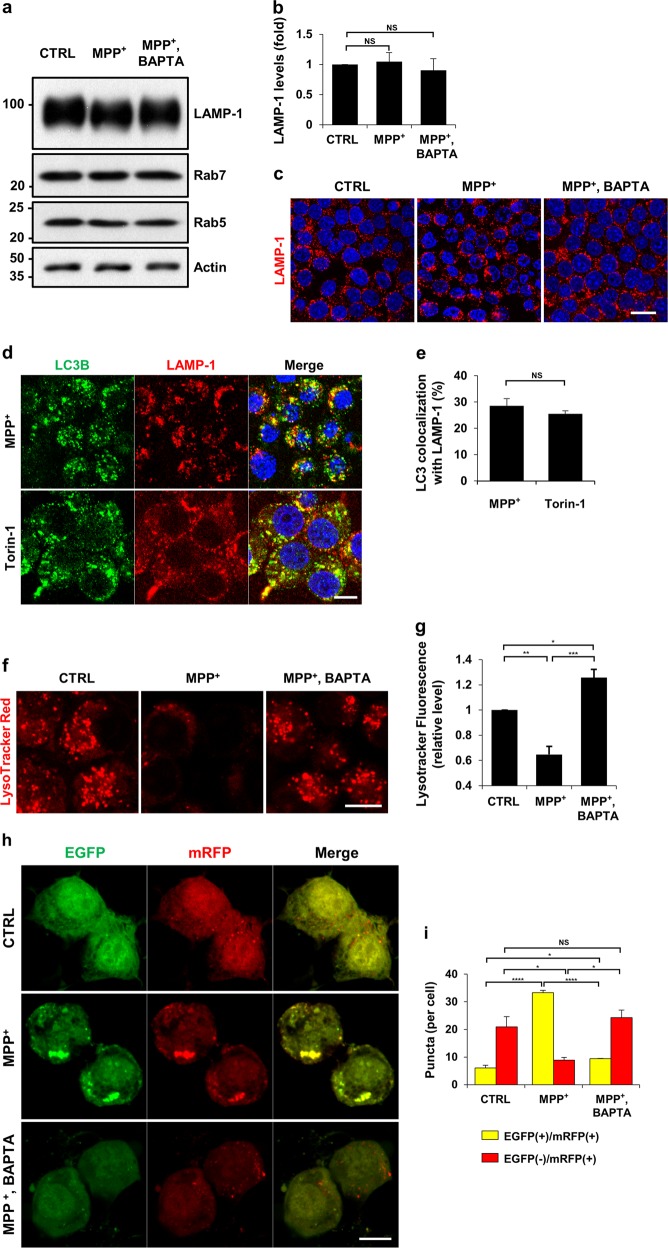
Fig. 4. MPP+-induced impairment of autophagic degradation results from lysosomal malfunction in a calcium-dependent manner.
a–c MN9D cells were treated with 50 μM MPP+ alone or in combination with 30 μM BAPTA-AM for 30 h. a Cell lysates were subjected to immunoblot analyses with the indicated antibodies. b Quantification of LAMP-1 expression was performed after normalization to actin loading control. Bars represent the mean ± SEM of three independent experiments. NS, not significant. c After drug treatment, cells were immunostained with anti-LAMP-1 antibody. Representative confocal images are provided. Scale bar represents 20 μm. d, e MN9D cells were incubated with 50 μM MPP+ for 30 h or 500 nM Torin-1 for 24 h and then immunostained using anti-LC3 and anti-LAMP-1 antibodies. The scale bar represents 10 μm. e Co-localization of LC3 with LAMP-1 in cells was quantified using ImageJ. Confocal images of at least 30 randomly selected cells from each of the three independent experiments were used for quantitation. Spots that were positive for both LC-3 and LAMP-1 were counted and expressed as a percentage of all LC3-positive spots (100%). Bars represent the mean ± SEM of three independent experiments. NS, not significant. f, g MN9D cells that were treated with 50 μM MPP+ alone or in combination with 30 μM BAPTA-AM for 30 h were stained with LysoTracker Red. Representative confocal images are provided. The scale bar represents 10 μm. g For quantitation, cells were subjected to flow cytometry. Data represent the fluorescence intensity relative to that of control cells (value = 1). Bar represents the mean ± SEM of three independent experiments. *p < 0.05; **p < 0.01; ***p < 0.001. h MN9D cells were transfected with mRFP-EGFP-tagged LC3B probe for 24 h and treated with 50 μM MPP+ alone or in combination with 30 μM BAPTA-AM for 30 h. After fixation, fluorescent images were acquired using confocal microscopy. The scale bar represents 10 μm. i Quantification of the number of yellow puncta (mRFP+-EGFP+-LC3B) and red puncta (mRFP+-EGFP−-LC3B) were performed using at least 50 cells per condition. Bar represents the mean ± SEM of three independent experiments. *p < 0.05; ****p < 0.0001; NS, not significant

