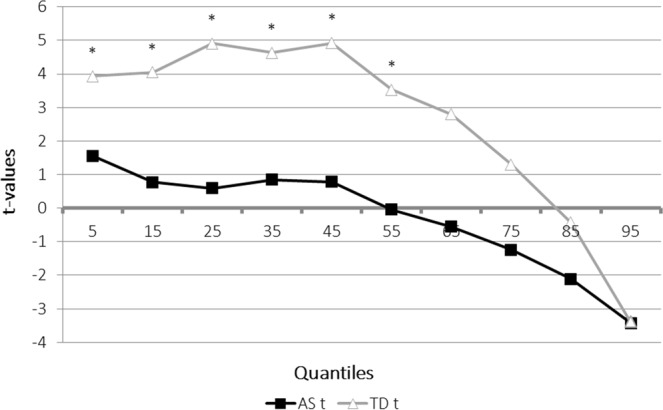
Figure 2.

The graph represents the difference in milliseconds (Y axis) between the model prediction based on the auditory and visual conditions, and the RTs obtained in the audiovisual conditions for each group (AS and TD). Positive values represent RTs that were faster than the race model prediction. The difference between the bound (represented as 0 on the Y axis) and the RTs of the bimodal condition are computed for each percentile of the RT distribution (X axis). *indicates significant violation of the race model (p < 0.005).
