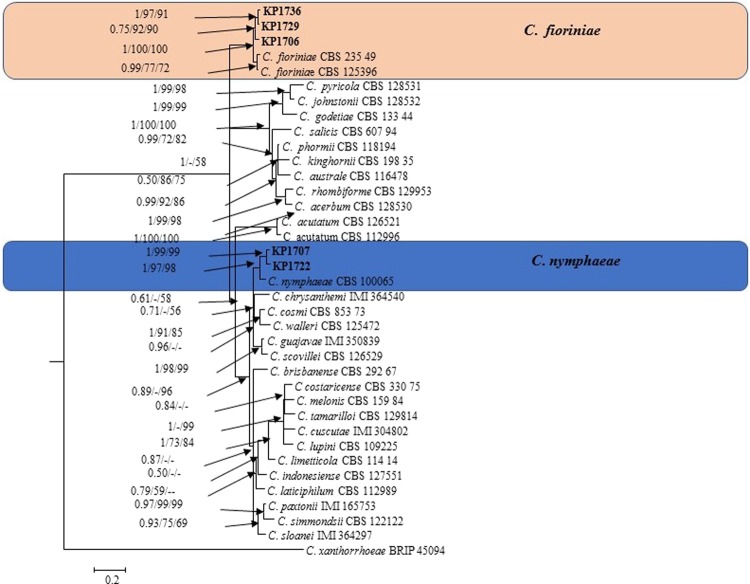
Figure 3.
Bayesian phylogeny (BI) according to a 50% majority rule consensus tree using combined sequence alignment of ITS, TUB2, GAPDH, ACT, and CHS-1. Colored blocks indicate the two clades containing plum isolates. Bayesian posterior probability values ≥ 0.5 and bootstrap support values ≥ 50% of maximum parsimony analysis and maximum likelihood analysis are given at the nodes. The scale bar shows the number of substitutions expected per site. C. xanthorrhoeae BRIP 45094 was used as the out-group.

