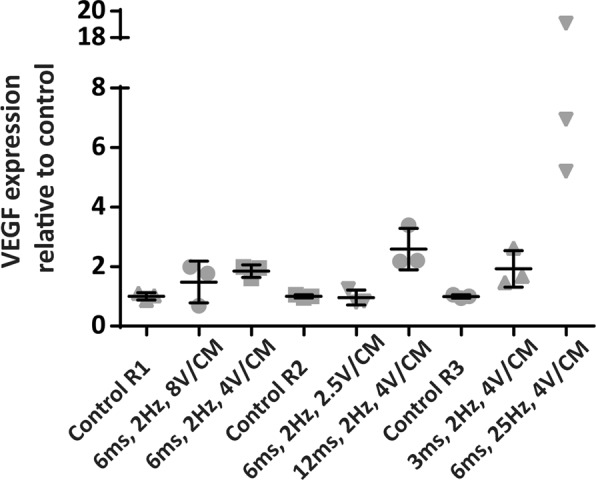
Figure 2.

Three stimulation runs, each containing two ES groups and a control, were performed to analyse the effect of different treatment settings. Using 4 V/cm, 6 ms pulse duration and 2 Hz a 1.85 times increase in VEGF concentration was found compared to non-stimulated control. Elevated levels of VEGF were also found when we increased/decreased voltage. In the elevated pulse duration and frequency groups, cells were substantially detached which was in part reflected by increased cell death, especially in the 25 Hz group, explaining the highly increased VEGF A expression. Values are expressed as the mean VEGF expression relative to control. N = 3 per stimulation protocol.
