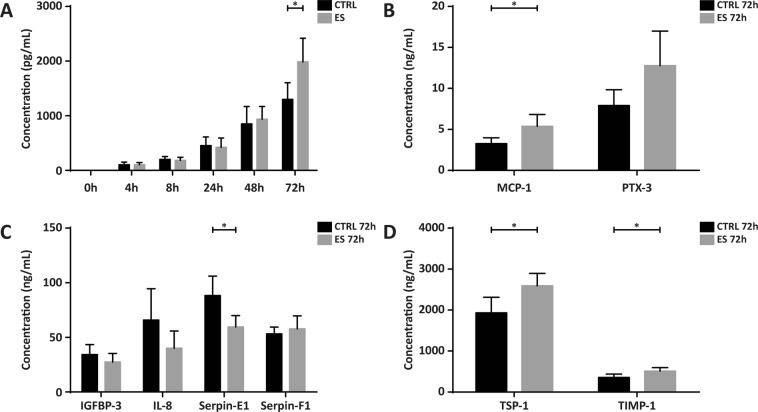
Figure 4.
Quantification of the identified proteins with ELISA. (A) Concentrations of VEGF in the CM over time, ES vs. CTRL. The concentration at 72 h was significantly different for ES compared to CTRL (p = 0.04). The gradual rise in concentration visible in the time curve was representative for that of the other proteins. (B) MCP-1 was significantly increased in ES vs CTRL (p = 0.04), whereas the increase in PTX-3 did not reach statistical significance (p = 0.08). (C) Serpin-E1 was significantly decreased in ES vs CTRL (p = 0.03), whereas IGFBP-3, IL-8 and Serpin-F1 were not statistically different. (D) TSP-1 and TIMP-1 were both significantly increased in ES vs. CTRL (p = 0.03 and p = 0.04, respectively). Values displayed are mean + SD. *p < 0.05. n = 4 per group.

