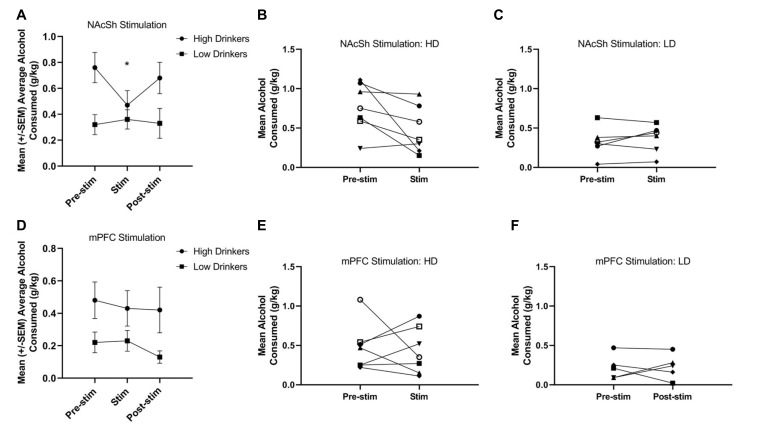
Figure 4.
Response to 130 Hz NAcSh and mPFC stimulation. NAcSh stimulation led to a significant decrease in alcohol consumption from training (pre-stimulation) to the stimulation sessions in the HD only (F(1,11) = 5.89, p = 0.03, = 0.35; A). Panels (B,C) represent the individual responses to NAcSh stimulation in HD and LD, respectively. Neither HD or LD showed a significant change in alcohol consumption due to mPFC stimulation (F(1,10) = 0.04, p = 0.85, = 0.00; D). Panels (E,F) represent the individual responses to mPFC stimulation in HD and LD, respectively (n = 5–7/group). Asterisk denotes a significant change of p < 0.05.

