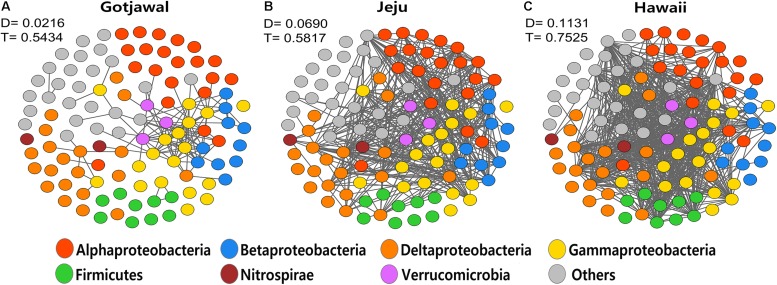
FIGURE 6.
Network of co-occurring microbial genera based on correlation analysis for (A) Gotjawal, (B) forest on Jeju Island, and (C) Hawaii. A connection stands for a strong (Spearman P > 0.8) and significant (P < 0.01) correlation. Nodes are colored according to phylum. D, density; T, transitivity.

