FIGURE 2.
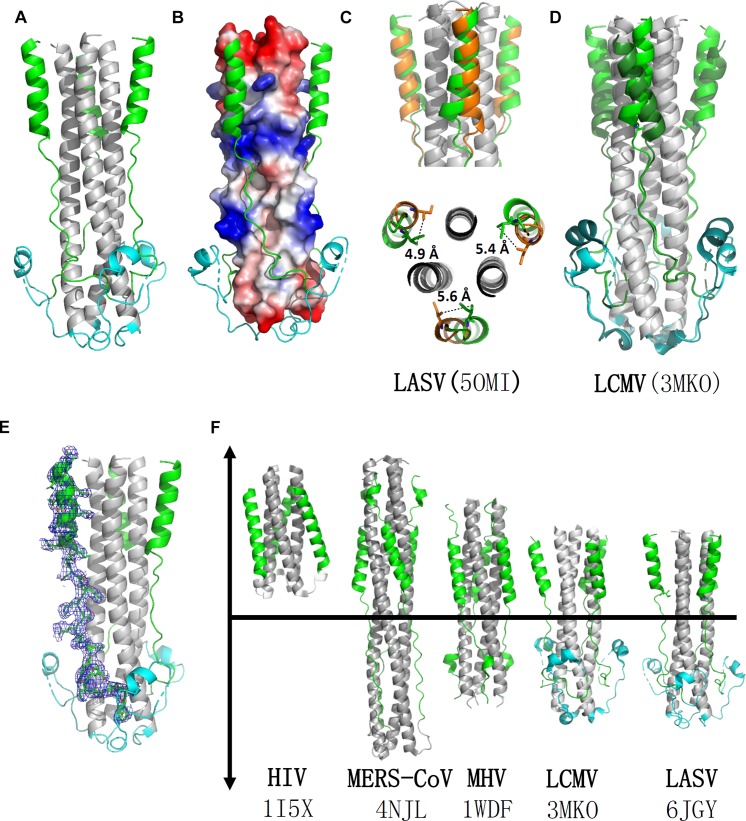
Crystal structure of LASV fusion core. (A) The overall structure of HR1-T-loop-HR2 domains of LASV is shown in cartoon representation. HR1 domain is colored in gray, T-loop is in cyan and HR2 is in green. (B) The HR1 trimer core is shown as electrostatic potential surface. (C) Comparing the structure with another reported LASV 6-HB structure (PDB: 5OMI), the HR2 domain of which is colored in orange. (D) Comparing the structure with fusion core structure of LCMV (PDB: 3MKO), the T-loop domain and HR2 domain of which are colored in dark green. (E) The electron density map of HR2 domain are shown as blue mesh. (F) Structural comparison of different fusion cores, including HIV (PDB: 1I5X), MERS-CoV (4NJL), MHV (PDB: 1WDF), LCMV (PDB: 3MKO), and LASV (PDB: 6JGY). Their HR1 domains are colored in gray, HR2 in green, and T-loop in cyan.

