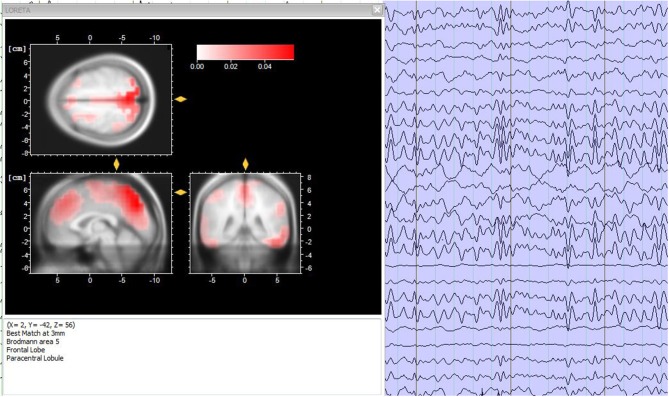
Figure 5.
Source analysis. (Left) Sources localization of the EEG frequencies for a time period of 3 s, accomplished through the LORETA analysis. (Right) 3-s period electroencephalographic pattern of a healthy subject. Image obtained on a 40 years-old healthy volunteer with hybrid EEG-fMRI system and included for illustrative purpose only.

