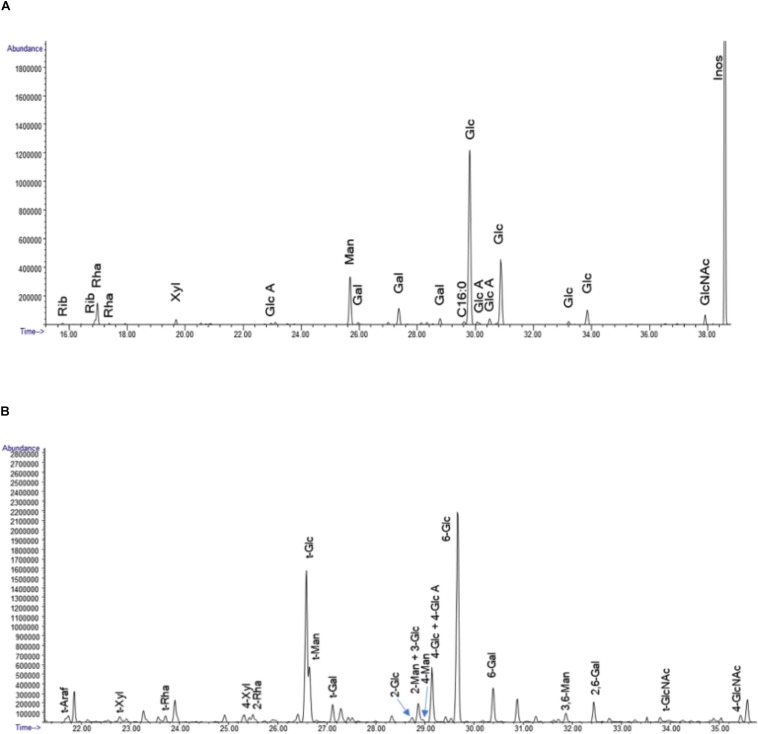
FIGURE 13.
(A) The GC chromatograms of the TMS derivatives of the dialyzed sample. The data represent the spectrometry (GC/MS) of the per-O-trimethylsilyl (TMS) derivatives of the monosaccharide methyl glycosides produced from the sample by acidic methanolysis method. (B) GC chromatogram of the PMAA derivatives of the sample. The linkage method, for glycosyl linkage analysis, the samples were permethylated, reduced, repermethylated, depolymerized, reduced, and acetylated; and the resultant partially methylated alditol acetates (PMAAs) analyzed by gas chromatography-mass spectrometry (GC-MS).

