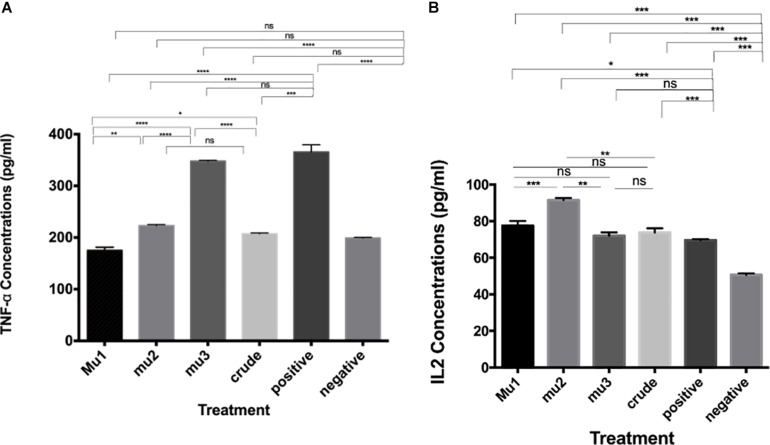
FIGURE 3.
Induction of TNFα and INFγ by mushroom polysaccharides in PBMC cells. ELISA assays to quantify the levels of TNF-α (A) and IL-2 (B) induced by the crude extract and the mushroom fractions in PBMC cells; Mu1, Mu2 and Mu3 (5 mg/ml) for 24 h. All groups were compared with the positive control (induced with 100 μl of E. coli LPS and INFγ, 10 ng/ml). Data are mean and SD, ****p < 0.0002, ∗∗∗p < 0.001, ∗∗p < 0.01, *p < 0.030 and ns p = 0.332 with one-way ANOVA with multiple comparisons (n = 2).

