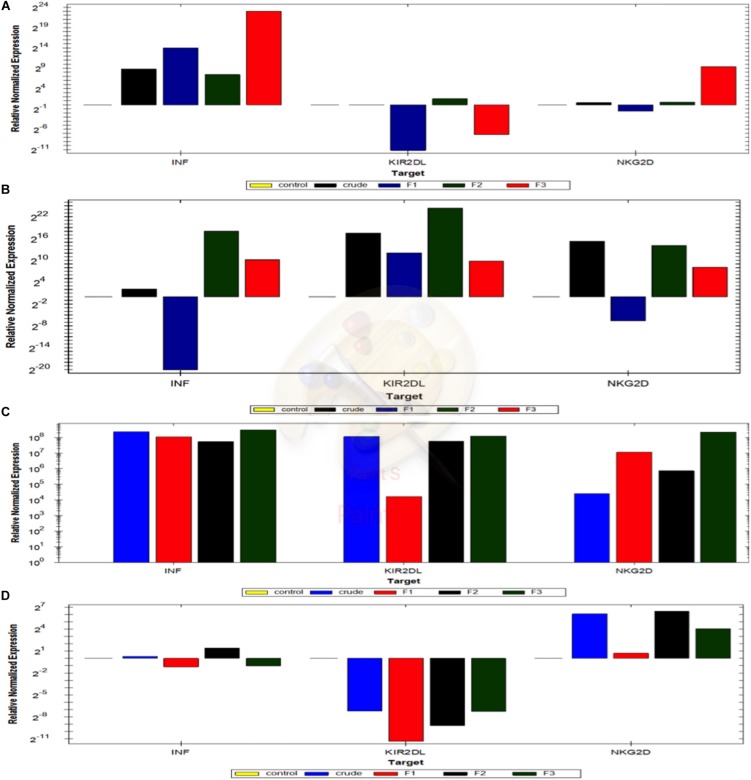
FIGURE 9.
Quantification of the activation markers of NK cells in NK-Cancer cells model using RTqPCR. The expressing levels of INF gamma, KIR2Dl and NKG2D genes of NK cells reactivated with crude extract, mushroom fraction no. 1 (F1), mushroom fraction no. 2 (F2), mushroom fraction no. 3 (F3) for 3 days and co-incubate with target cancer cells MCF7 (D) and A549 cells (C) for 3 days with ratio 1:3 (target: effector cells) in the absence of IL2 and with MCF7 (B) and A549 cells (A) in the presence of IL2. All results were normalized using β actin gene expression and relative to the positive control cells (target cells with NK cells). All figures above the control base line represent the upregulation folding and that below the control base line represent downregulation folding.

