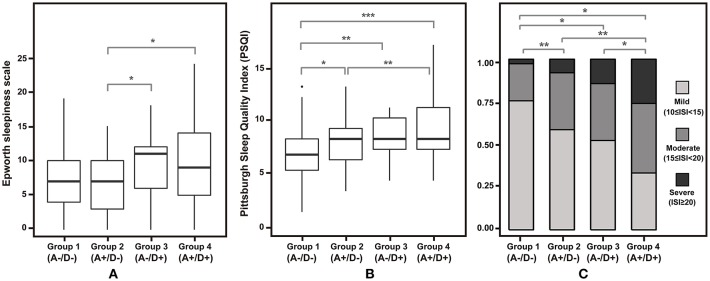
Figure 2.
Differences in scores on sleep-related scale across four groups. (A) Epworth sleepiness scale and (B) Pittsburg sleep quality index is depicted in box plots. (C) Proportion of each insomnia severity index category is shown in a stacked bar plot. A–/D–, without anxiety or depression; A+/D–, with anxiety only; A–/D+, with depression only; A+/D+, with both anxiety and depression; *p < 0.05, **p < 0.01, and ***p < 0.001.

