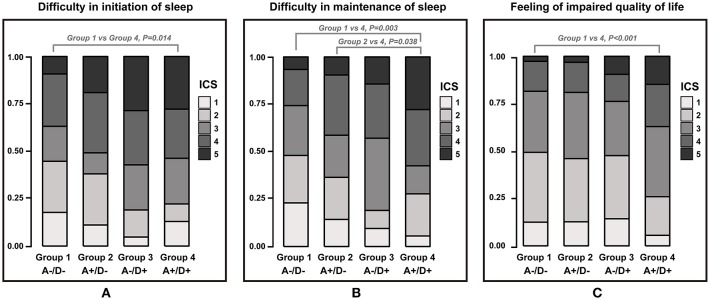
Figure 3.
Stacked bar plot showing the proportion of each insomnia characteristic scale 1–5 across groups. A–/D–, without anxiety or depression; A+/D–, with anxiety only; A–/D+, with depression only; A+/D+, with both anxiety and depression. Insomnia characteristic scale (ICS) was graded on a scale of 1–5.

