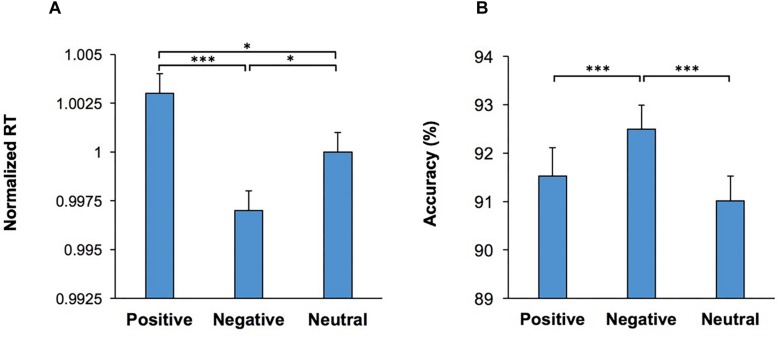
FIGURE 2.
Emotional content of images shown as the start cue influenced performance in the WCST. (A) Response time (RT) in correct trials are shown for each emotional category. RT was lowest in trials which contained a negative visual stimulus (shown as the start cue) (B) The percentage of correct trials are shown for each emotional category. Accuracy was the highest in trials which contained a negative visual stimulus. *represents p < 0.05, ∗∗∗represents p < 0.001.

