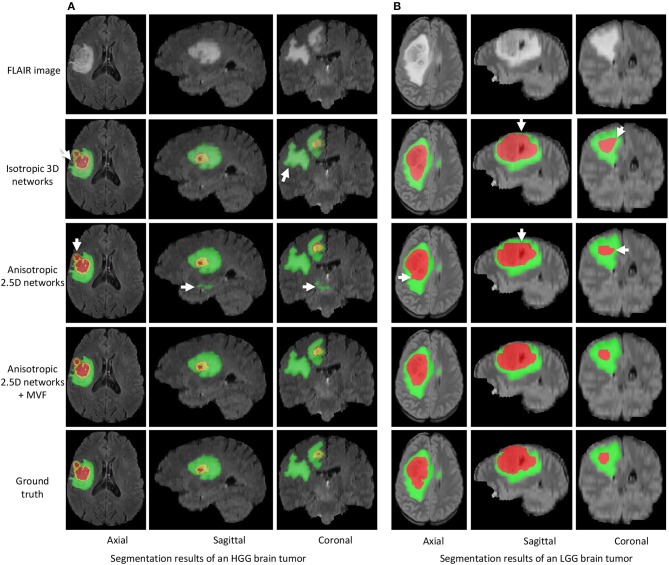
Figure 3.
Segmentation results of an HGG brain tumor (A) and an LGG brain tumor (B) from our local validation set, which is part of BraTS 2017/2018 training set. Edema, non-enhancing tumor core and enhancing tumor core are visualized in green, red, and yellow, respectively. White arrows highlight some mis-segmentations.

