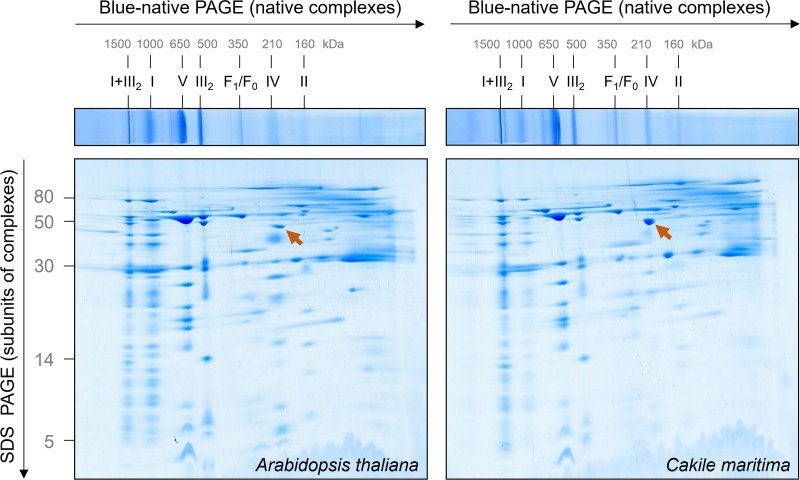
FIGURE 2.
Comparative analysis of the mitochondrial proteomes of Arabidopsis thaliana and Cakile maritima by Blue native/SDS–PAGE. Mitochondria purified from cell suspension cultures were solubilized by digitonin. Subsequently, protein fractions were supplemented with Coomassie-blue and separated by 2D Blue native/SDS–PAGE. After the second gel dimension, gels were Coomassie stained. Molecular masses of standard protein complexes are given above, molecular masses of monomeric proteins to the left of the 2D gel (in kDa). Identities of the protein complexes are given above the BN gel. Designations: I + III2, supercomplex composed of complex I and dimeric complex III; I, complex I; V, complex V (ATP synthase); III2, dimeric complex III; F1, F1 part of ATP synthase; F0, F0 part of ATP synthase; IV, complex IV; II, complex II. The arrow points to glutamate dehydrogenase.

