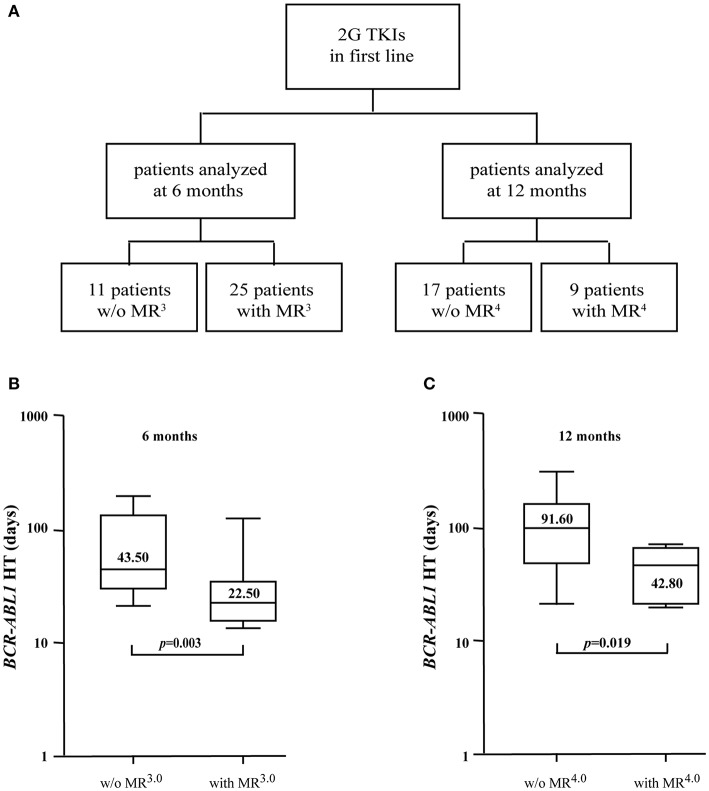
Figure 3.
BCR-ABL1 HTs in patients receiving 2G TKIs as first-line therapy. (A) BCR-ABL1 HTs were calculated in a total of 62 samples evaluated after 6 (n = 36) or 12 (n = 26) months of treatment with 2G TKIs. Boxplots delimited by the 25th (lower) and 75th (upper) percentile indicate HTs comparing individuals with or without an MR3.0 after 6 months (B) or subjects with or without an MR4.0 after 12 months (C) of therapy. Horizontal lines above and below each boxplot indicate the 5th and 95th percentile, respectively. Numbers inside each boxplot represent median values observed within each patient cohort. The reported p-values indicate statistical significance between the two patient groups included in each panel.

