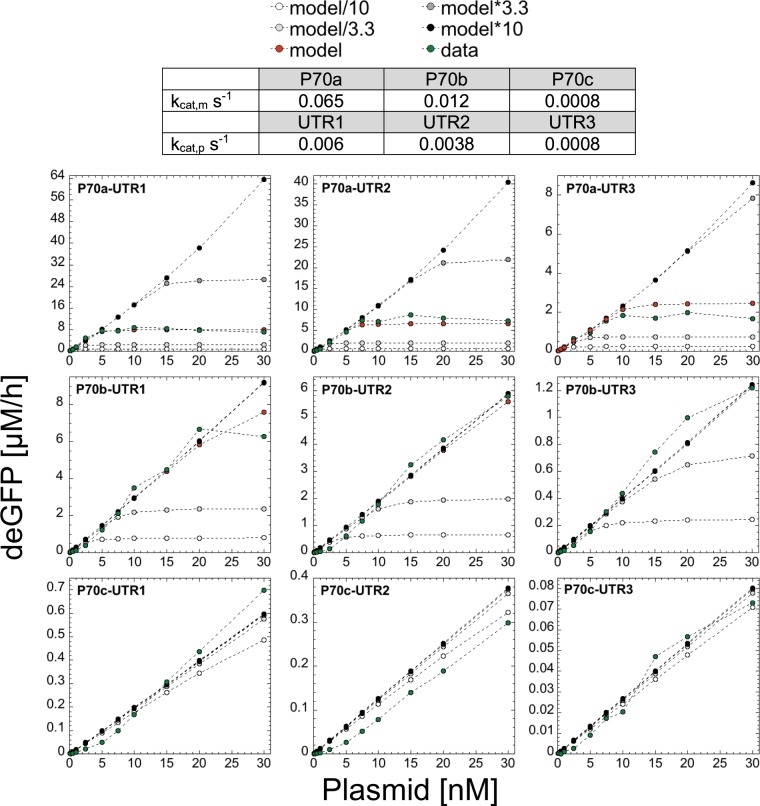
Figure 3.
Model Sensitivity to changing the ribosome concentration (1100 nM ribosome as best fit numerical value). Model results for combinations of three promoters and UTRs for the four different concentrations of total ribosomes (/10, /3.33, *3.33, *10) in addition to the best fit. Model*10 means that the concentration of ribosomes is 10*1100 = 11000 nM. Note that when the red dots (model) are not visible, it means that they overlap with the black dots (model*10).

