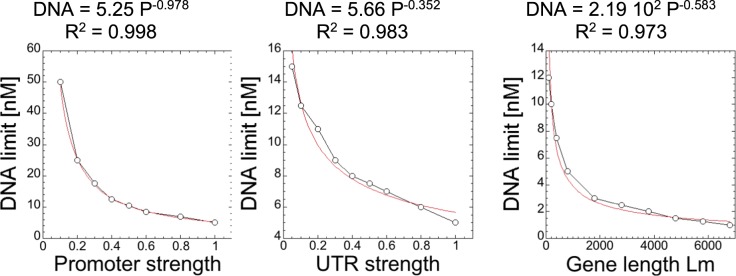
Figure 5.
Model predictions for the approximate limiting DNA concentration for different promoter strengths, UTR strengths, and lengths of gene. Each data set was constructed by varying each specific constant (kcap,m, kcat,p, Lm) and fit to a power function, then combined to form the final Eq. (28). The factor of 250 in Eq. (28) is due to the length of gene not being normalized, 2.19 102 is divided by the limiting DNA concentration at the length of deGFP (800 nt), which is 4.43 nt. That value is multiplied by the limiting DNA concentration for P70a-deGFP, where P = 1, U = 1, and Lm = 800, which is 5 nM. The power function is chosen only because it is a good fit phenomenologically, not for some physiological reasons. The load calculator is just a tool to approximate when the resources will become limiting and the protein synthesis rate will not be in the linear regime. The obtained value tells us how sensitive each parameter is to the limiting DNA concentration, such that they can be combined in one single TXTL load calculator equation.

