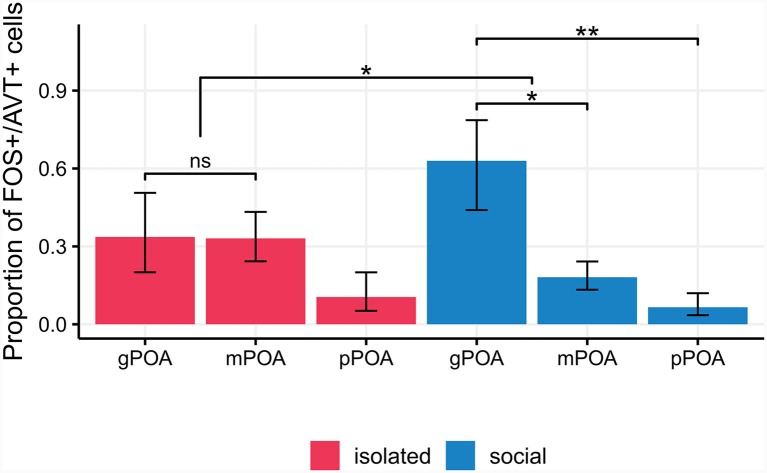
Figure 5.
Isolated males show no significant differences in the proportion of FOS+/AVT+ cells between the different POA cell types (pairwise p-values > 0.14). In social males, the proportion of FOS+/AVT+ is significantly higher for gPOA cells than for mPOA cells (p = 0.02), and pPOA cells (p = 0.003). This difference in the activation profile of gPOA and mPOA cell types between experimental conditions is statistically significant (p = 0.03). pPOA, parvocells; mPOA, magnocells; gPOA, gigantocells. *p < 0.05, **p < 0.01, ***p < 0.001; ns, non-significant.

