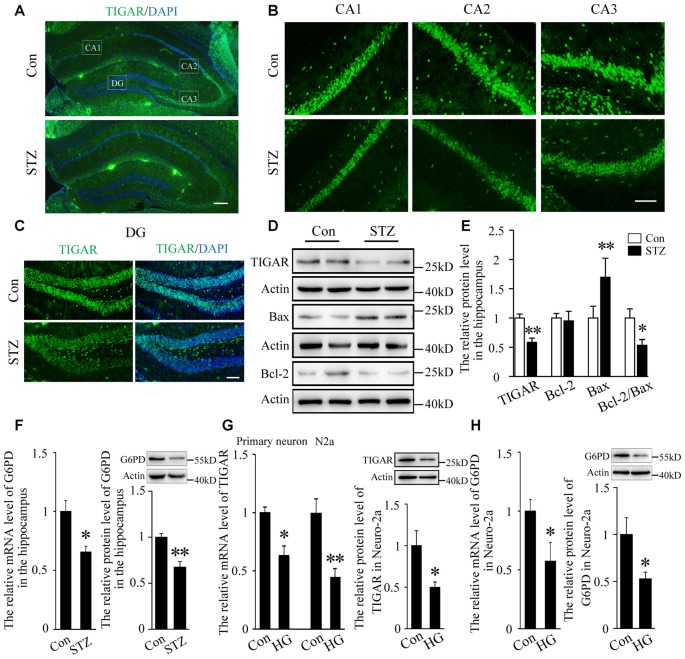
Figure 1.
TP53-inducible glycolysis and apoptosis regulator (TIGAR) expression in the hippocampus of streptozotocin (STZ)-induced diabetic mice. (A) Immunofluorescent staining of TIGAR expression in the hippocampus in control group and STZ-treated group. Scale bar = 200 μm. (B,C) The expression of TIGAR in the CA1, CA2, CA3 and dentate gyrus (DG) of the hippocampus. Scale bar = 50 μm. (D,E) Western blot analysis of TIGAR, Bcl-2 and Bax in the hippocampus of each group (n = 6 per group). (F) Quantification of the mRNA and protein levels of glucose 6-phosphate dehydrogenase (G6PD) in each group (n = 4 per group). (G) Quantification of the mRNA and protein levels of TIGAR in high glucose-treated hippocampal primary neurons and Neuro-2a cells (n = 3–6 per group). (H) Quantification of the mRNA and protein levels of G6PD in high glucose-treated Neuro-2a cells (n = 3–4 per group). *p < 0.05, **p < 0.01, t-test. Data represent the mean of at least three independent experiments.

