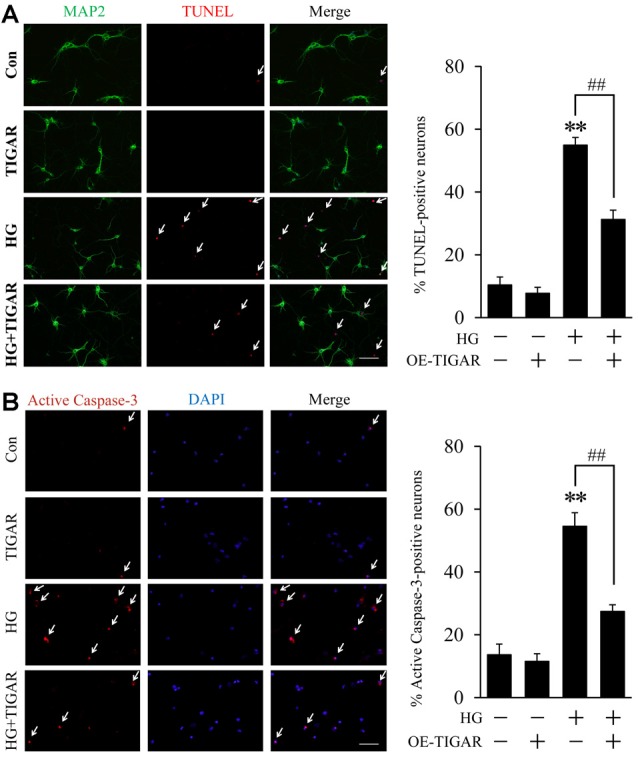
Figure 2.

TIGAR reduced high glucose-induced neuronal apoptosis. (A) TUNEL and MAP2 staining and quantification of TUNEL-positive primary neurons in each group (n = 9 per group). (B) Immunofluorescent staining of active Caspase-3 and quantification of active Caspase-3-positive cells in each group (n = 9 per group). Scale bar = 50 μm. **p < 0.01 vs. the control group, ##p < 0.01 vs. the high glucose (HG) group, two-way ANOVA.
