Figure 3.
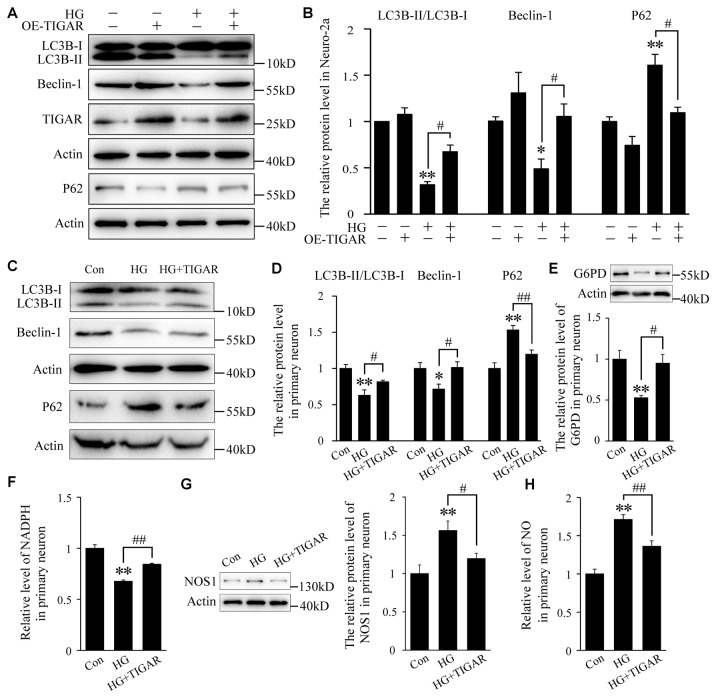
TIGAR ameliorated high glucose-mediated autophagy impairment. (A,B) Western blot analysis of LC3B, Beclin-1, TIGAR and P62 after treatment with Lenti-TIGAR and 50 mM glucose in Neuro-2a cells (n = 4 per group). (C,D) Western blot analysis of LC3B, Beclin-1 and P62 in primary neuron in each group (n = 4 per group). (E) Western blot analysis of G6PD in each group (n = 4 per group). (F) The relative level of NADPH in primary neuron (n = 6 per group). (G) Western blot analysis of nitric oxide synthase 1 (NOS1) in each group (n = 4 per group). (H) The relative level of NO in primary neurons (n = 6 per group). *p < 0.05, **p < 0.01 vs. the control group, #p < 0.05, ##p < 0.01 vs. the HG group, one-way or two-way ANOVA.

