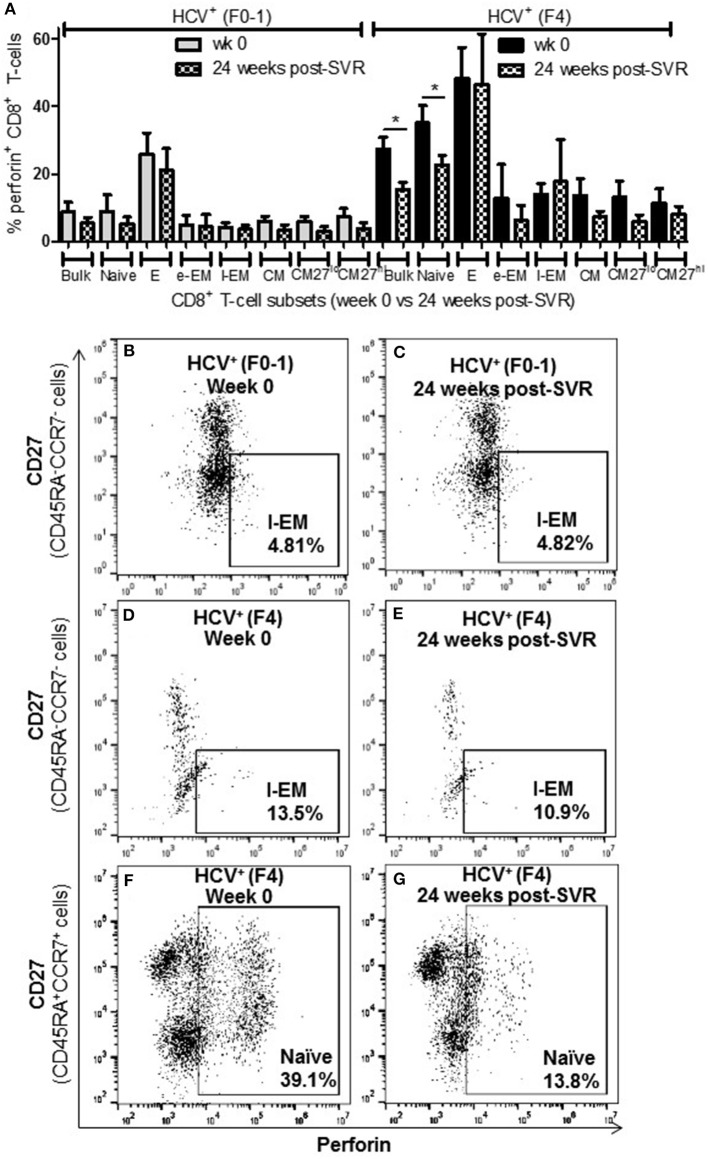
Figure 7.
The proportion of perforin+ CD8+ T-cells remains elevated in most cell subsets long after elimination of chronic HCV infection in individuals with advanced liver fibrosis. Isolated CD8+ T-cells from PBMCs collected from HCV-infected individuals before treatment with direct-acting anti-HCV therapy (DAA) and 24 weeks post-SVR were stimulated with anti-CD3/–CD28 for 48 h followed by the detection of perforin+ cells were detected in cell subsets by flow cytometry. (A) The proportion of perforin+ cells in CD8+ T-cells and subsets thereof is summarized in a bar graph, showing data for week 0 and 24 weeks post-SVR in colored and hatch bars, respectively. Statistical significance is indicated with a “*” (one-way ANOVA and Dunnett's post-test, p ≤ 0.05, n = 4 in each study group). Representative dot plots demonstrate (B,C) the low level of perforin+ l-EM cells in HCV-infected individuals with minimal fibrosis, and how this was stable long after therapy compared to the higher proportion of perforin+ l-EM cells in individuals with advanced liver fibrosis (D,E). (F,G) Finally, a representative dot plot depicts how the increased proportion of perforin+ naïve CD8+ T-cells in a sample from an HCV-infected individual with advanced liver fibrosis was the only subset to demonstrate a significant decrease in perforin expression after DAA therapy.

