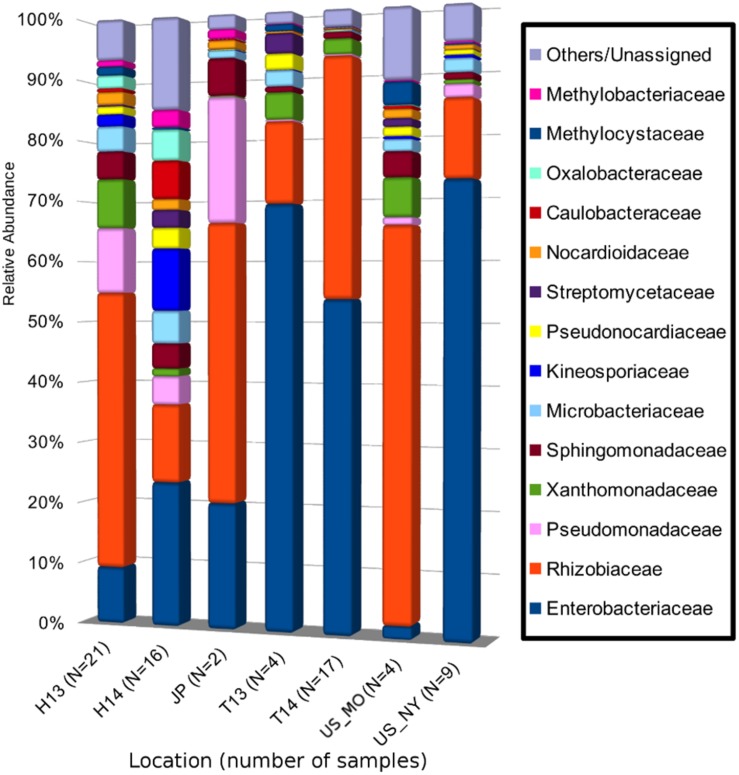
FIGURE 2.
Mean relative abundance of bacterial 16S rRNA gene sequences at the family level of taxonomic classification in each sampling site. Each bacterial family is represented as a different color in the bar chart. The combined relative abundances total to 100% for each site. H13, Hungary (Heves) samples collected in 2013; H14, Hungary (Bacs-Kiskun) samples collected in 2014; T13, Tunisia (Regueb) samples collected in 2013; T14, Tunisia (Regueb) samples collected in 2013; US_MO, United States (MO) samples collected in 2013; US_NY, United States (NY) samples collected in 2014; JP, Japan (Okayama) samples collected in 2004 and 2013. Numbers in brackets indicate the number of crown gall samples collected from each site.

