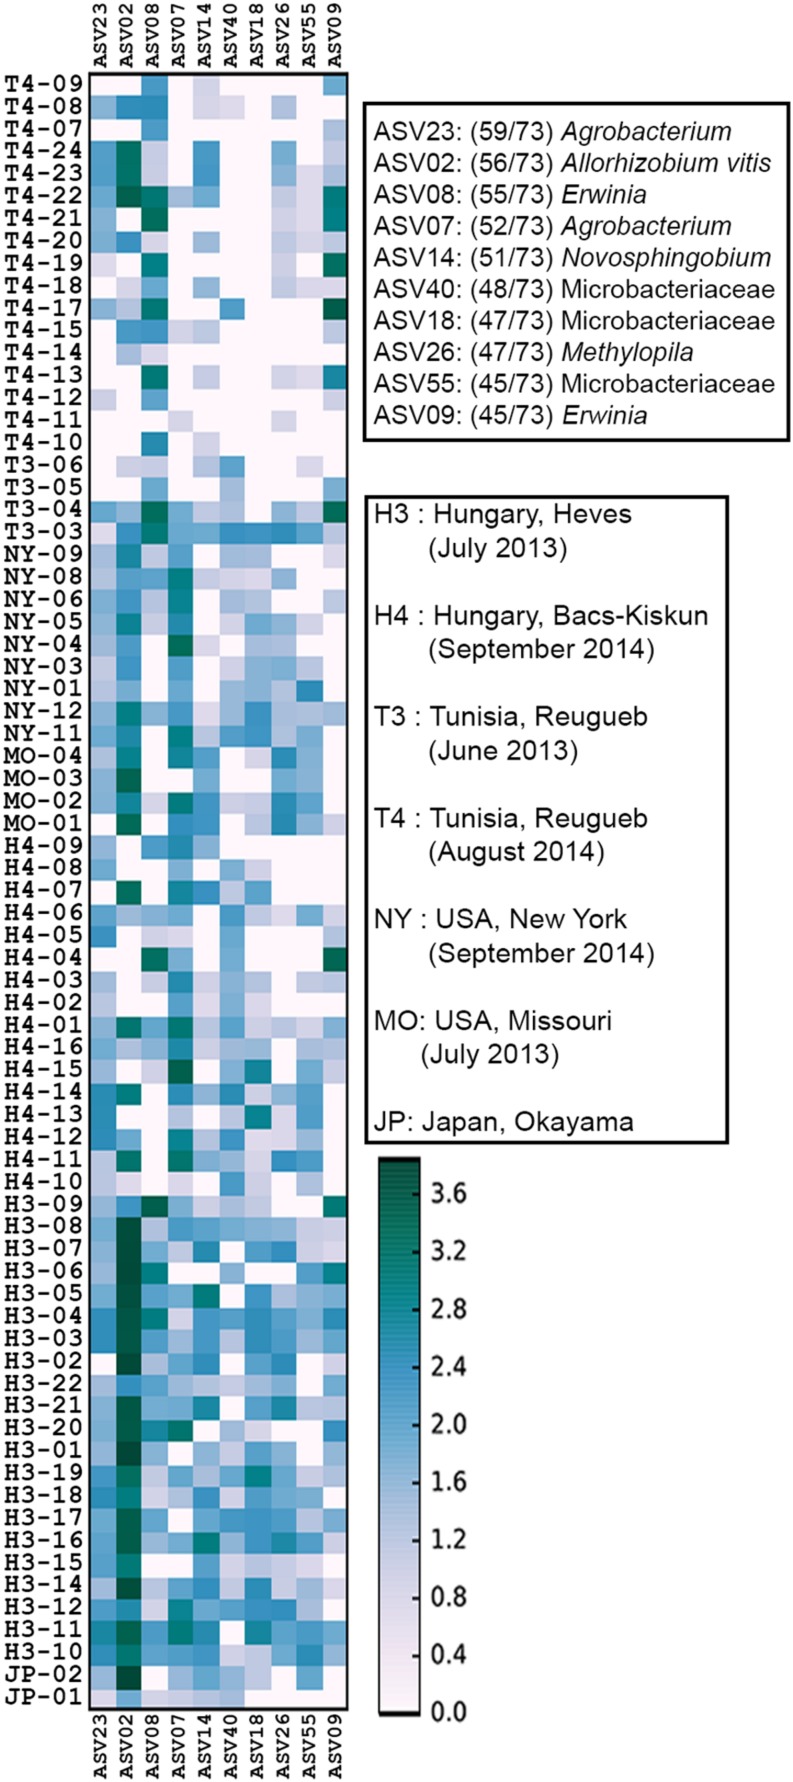
FIGURE 3.
Heat map of core microbiome abundance across 73 crown gall samples. The x-axis shows all 10 core ASVs in the order of decreasing prevalence. The prevalence (numbers in brackets next to each ASV) and classification of the 10 core ASVs to the lowest possible taxonomic rank were shown in the upper right legend. The heatmap scale indicates the abundance of ASV (normalized to 10,000 reads/sample) in a 10-based logarithmic scale.

