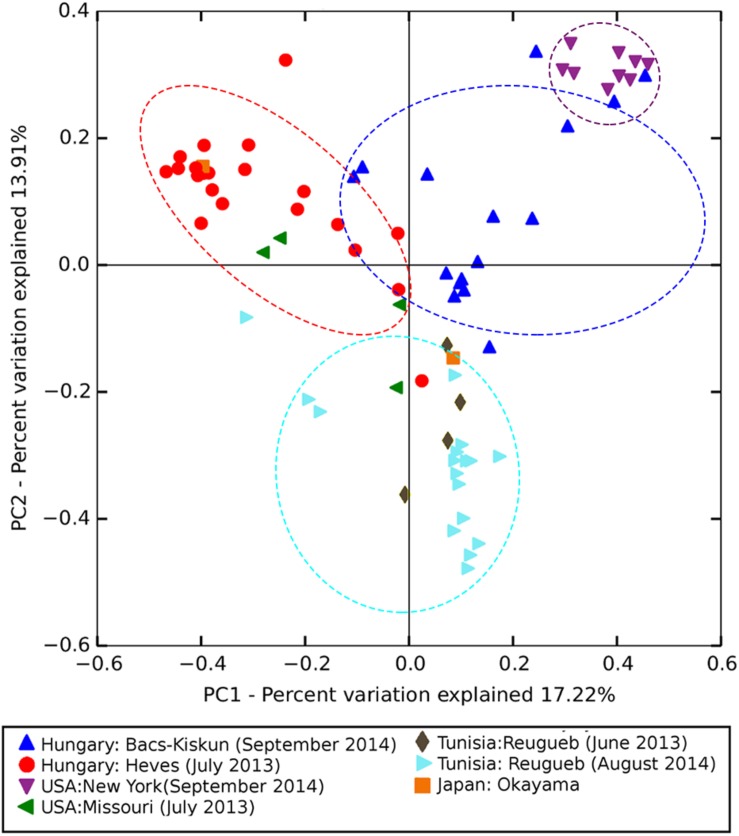
FIGURE 4.
Principal coordinate analysis (PCoA) ordination based on Bray–Curtis dissimilarity matrix showing significantly different (ANOSIM global R = 0.63, p-value = 0.001) microbial composition among sampling sites. Points in the PCoA plot represent crown gall samples each colored and shaped according to the sampling site. Points enclosed by dotted lines represent samples from major sampling sites (N > 10 samples).

