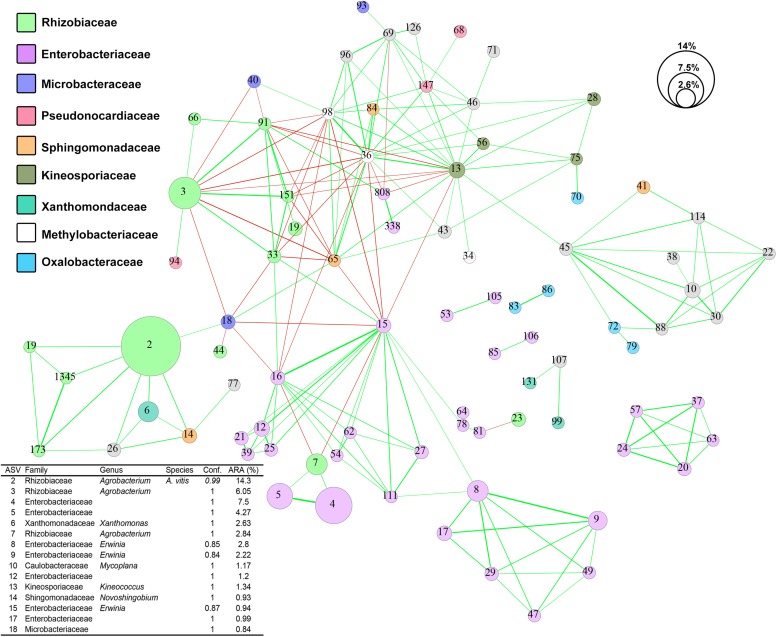
FIGURE 5.
Co-occurrence network of ASV sequences from 73 crown gall samples. Strong (–0.5 < R < 0.5) and significant (p-value < 0.001) co-occurrences between ASVs are displayed by lines connecting the nodes. The line thickness reflects the strength of the correlation while the color reflects positive (green) or negative (red) associations. Each node represents one ASV and was colored based on RDP naïve Bayesian taxonomic classification to the family level. The size of each node reflects the average percentage relative abundance of the ASV they represent. Conf., confidence score of RDP taxonomic assignment; ARA, average relative abundance.

