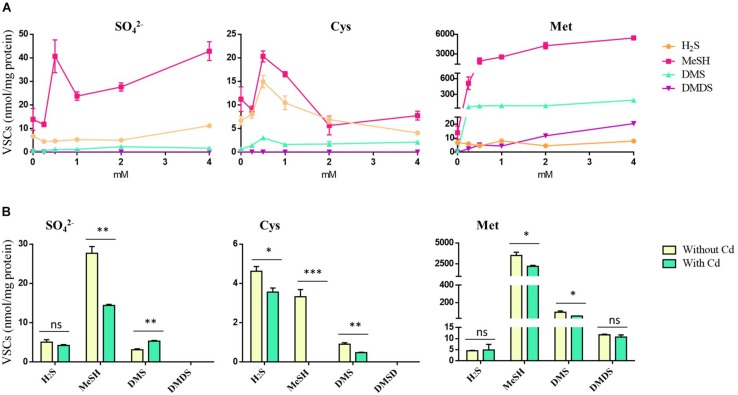
FIGURE 7.
VSCs produced by P. fragi GC01 from SO42–, Cys and Met under biosynthesis conditions. (A) VSC production from sulfur sources with concentrations ranging from 0 to 4 mM after 48 h of incubation. (B) VSC production under biosynthesis conditions with different sulfur sources in the presence or absence of CdCl2 (20 μg mL–1) after 48 h. Results represent the average of three biological replicates with their respective standard deviations. Student’s t-test (P < 0.05): Comparison between treatments with and without cadmium (Cd). Statistically significant differences are shown as: ∗∗∗P < 0.001, ∗∗P < 0.01, *P < 0.05.

