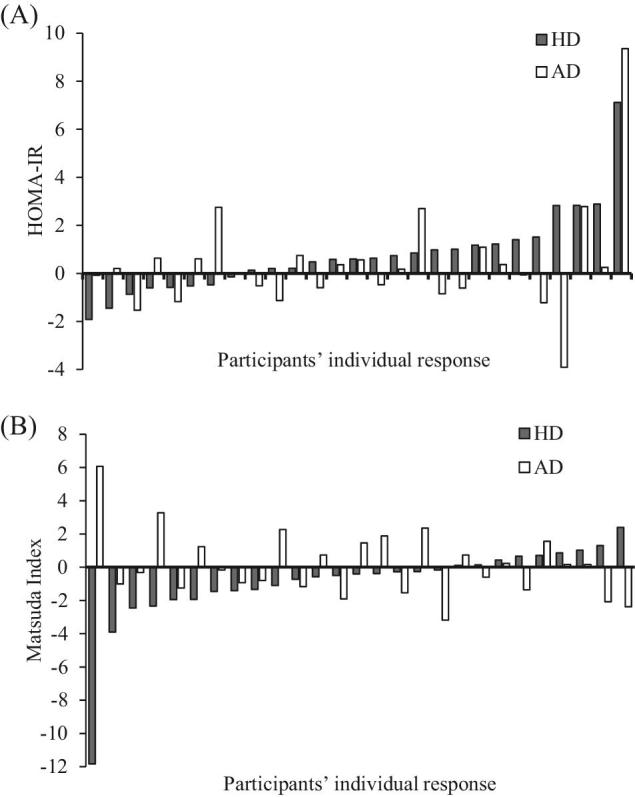
FIGURE 2.

Interindividual variability in response to HD and AD for insulin resistance and insulin sensitivity in ascending order for HD. (A) Changes in the HOMA-IR; (B) changes in the Matsuda index. n = 27. Data are presented as the individual differences between before and after the intervention. AD, adequate dairy product intake; HD, high dairy product intake.
