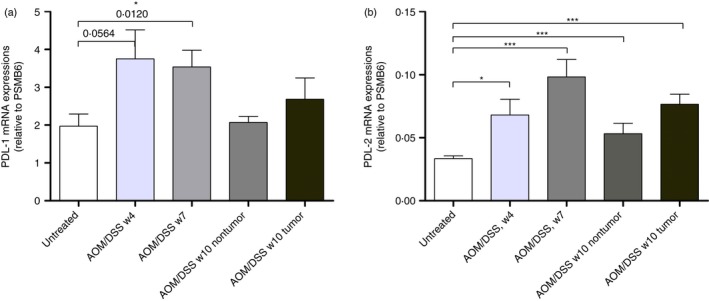
Figure 5.

PD‐L1 and PD‐L2 mRNA expression levels in mouse colons during dextran sulphate sodium (DSS)‐induced colitis. (a) PD‐L1 mRNA expression in untreated and azoxymethane (AOM)/DSS‐treated colonic tissue from weeks 4, 7 and 10 (n = 10). (b) PD‐L2 mRNA expression in untreated and AOM/DSS‐treated colonic tissue from weeks 4, 7 and 10 (n = 10). The data are normalized to proteasome subunit beta type‐6 (PSMB6) and shown as the mean ± SEM. Statistical analysis was performed using Student's t‐test, and P‐values are shown. P‐values < 0·05 were considered statistically significant.
