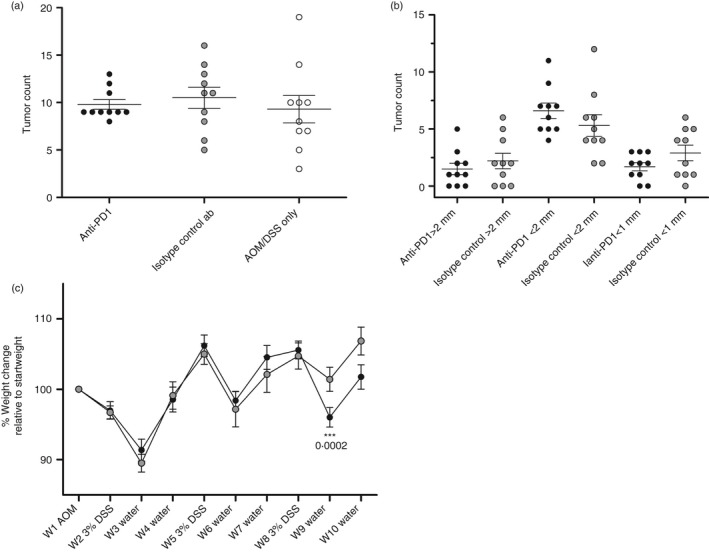
Figure 6.

Tumorigenesis and weight development in azoxymethane (AOM)/dextran sulphate soidum (DSS)‐treated mice. (a) Comparison of the total numbers of macroscopic tumours in mice treated i.p. with an anti‐PD‐1 ab, isotype control ab, or AOM/DSS only. Each circle represents an individual mouse (n = 10), and the mean ± SEM is shown. Statistical analysis was performed using Student's t‐test, and no significant differences were found. (b) Comparison of the tumour size in mice treated i.p. with an anti‐PD‐1 ab or isotype control ab. (c) Percentage body weight change relative to the week 1 baseline during the course of three 3% DSS administrations. Weights are presented as the mean ± SEM (n = 10). Statistical analysis was performed using Student's t‐test. P‐values < 0·05 were considered statistically significant.
