FIGURE 4.

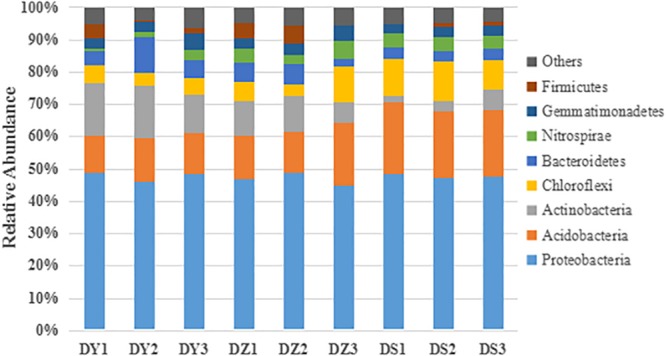
Taxonomic composition of the dominant bacteria at the phylum level in different soil samples. Others represent the relative abundance of the phyla outside the eight phyla.

Taxonomic composition of the dominant bacteria at the phylum level in different soil samples. Others represent the relative abundance of the phyla outside the eight phyla.