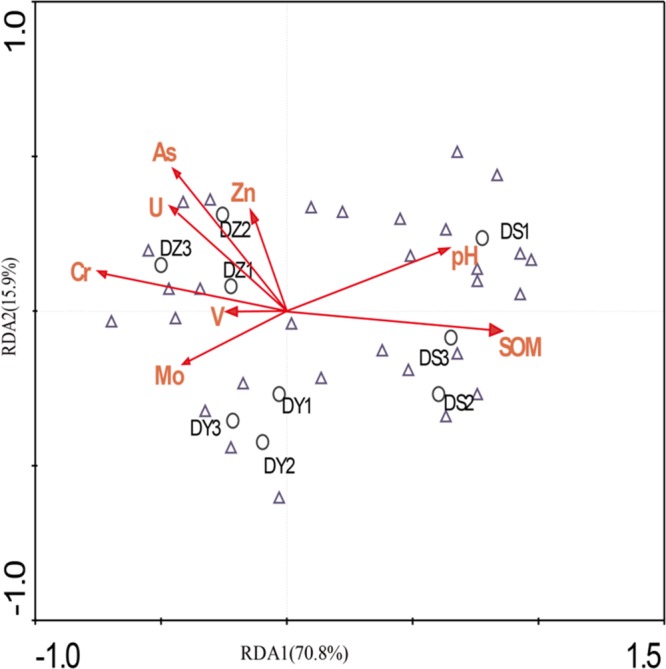
FIGURE 6.

Redundancy analysis of bacterial data and environmental parameters. Samples and species are represented as circles and triangles, respectively. Arrows indicate the directions and magnitudes of heavy metals associated with bacterial community structures.
