FIGURE 1.
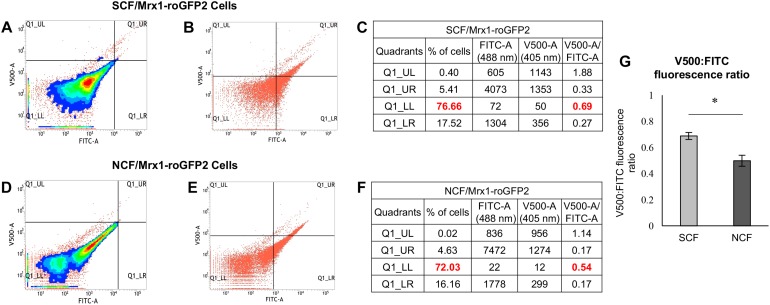
Determination of the oxidative status and ROS (hydroxyl radical and H2O2) levels in the unexposed freshly prepared SCF/Mrx1-roGFP2 and NCF/Mrx1-roGFP2 cells. Flow cytometry profile of roGFP2 fluorescence of: (A) SCF/Mrx1-roGFP2 cells, (D) NCF/Mrx1-roGFP2 cells. (B,E) Scatter plot of roGFP2 fluorescence of the respective cells from the data in (A,D), respectively. (C,F) Percentages of the respective cells in each quadrant with their V500 and FITC median fluorescence values and their ratios. The major proportion of the cells amongst the four quadrants and their fluorescence ratio are given in bold red color. (G) Quantitation of V500:FITC fluorescence ratio in the SCF/Mrx1-roGFP2 and NCF/Mrx1-roGFP2 cells (n = 3). Statistical significance was calculated using paired t-test where *Indicates p ≤ 0.05.

