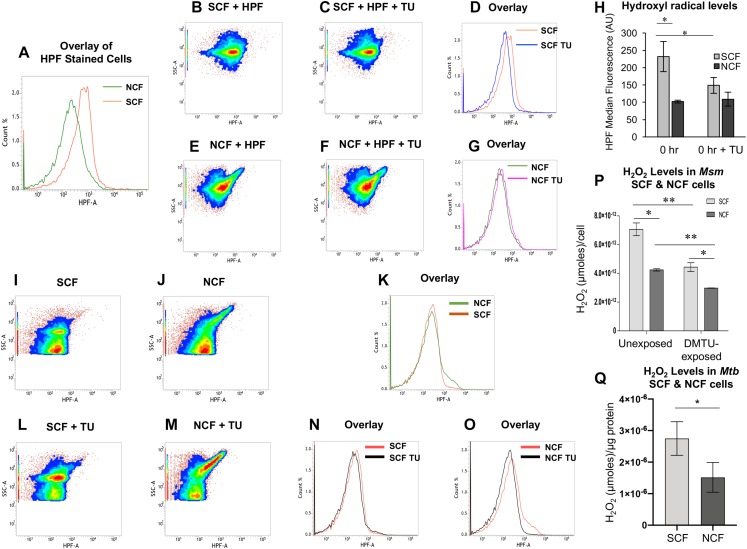
FIGURE 2.
The HPF fluorescence flow cytometry profile of Msm SCF and NCF cells and the ROS levels in the Msm and Mtb SCF and NCF cells. (A) Histogram overlay of the median fluorescence of HPF-stained Msm SCF and NCF cells. (B,E) and (C,F) Density plots of HPF-stained: Msm SCF and NCF cells in the (B,E) absence and (C,F) presence of non-toxic concentration of thiourea (5 μM, Nair et al., 2019), respectively. (D,G) Histogram overlay of median fluorescence in the absence and presence of thiourea for the HPF-stained Msm (D) SCF and (G) NCF cells. (H) Quantitation of the median fluorescence, indicating hydroxyl radical levels, in the HPF-stained Msm SCF and NCF cells after normalization with their respective autofluorescence samples from (I–O) (n = 3). Statistical significance was calculated using paired t-test where *Indicates p ≤ 0.05. (I,J) Flow cytometry profile of autofluorescence of unstained 104 cells/ml of Msm (I) SCF, and (J) NCF cells. (K) Histogram overlay of the unstained SCF and NCF cells. (L,M) Autofluorescence of unstained control cells of: (L) SCF and (M) NCF in the presence of thiourea (TU). (N,O) Histogram overlay of unstained (N) SCF cells (from I and L) and (O) NCF cells (from J and M) in the absence and presence of TU, respectively. (P) Quantitation of the levels of H2O2 per cell in the unexposed and DMTU-exposed non-toxic concentration of DMTU (1 mM; Supplementary Figures S1A–C) Msm SCF and NCF cells using Amplex Red assay (n = 3). (Q) Quantitation of the levels of H2O2 per μg protein in the Mtb SCF and NCF cells using Amplex Red assay (n = 3). The values of statistical significance in (P) and (Q) were calculated using paired t-test where * and ∗∗ indicate p ≤ 0.05 and p ≤ 0.01, respectively.

