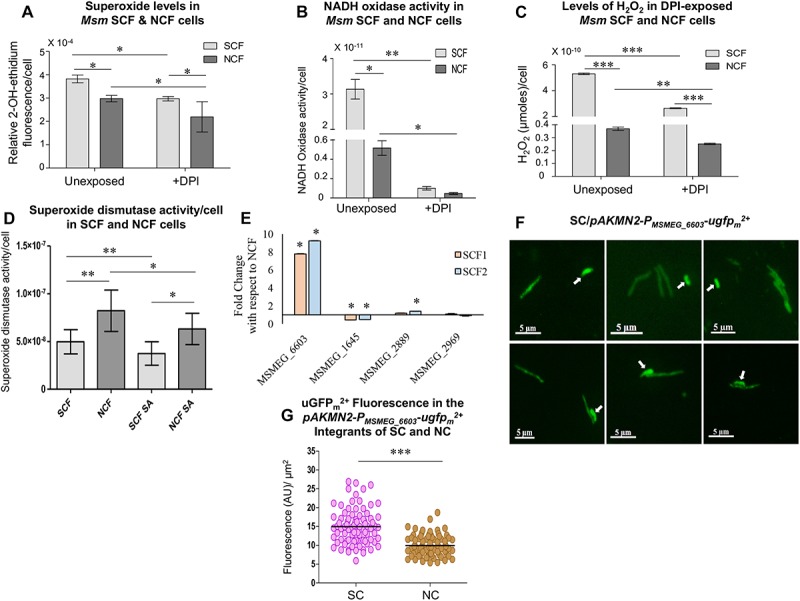
FIGURE 3.

Superoxide and H2O2 levels in SCF and NCF cells and analysis of NADH oxidase expression and activity. (A) Relative levels of 2-OH-ethidium fluorescence in SCF and NCF cells from unexposed and DPI-exposed conditions (n = 3). (B) NADH oxidase activity in SCF and NCF cells from unexposed and DPI-exposed conditions (n = 3). (C) Quantitation of H2O2 levels in SCF and NCF cells from unexposed and DPI-exposed conditions, using Amplex Red assay (n = 3 technical triplicates). (D) Superoxide dismutase (SOD) activity in SCF and NCF cells in the absence and presence of SOD inhibitor sodium azide (n = 6). (E) Fold change in the expression of NADH oxidase genes of SCF cells in normalized with the expression in NCF cells by qPCR (n = 2). (F) Fluorescence microscopy images of Msm/pAKMN2-PMSMEG_6603-ugfpm2+ MLP cells. Arrows indicate SCs. (G) Single cell fluorescence intensity analysis of SCs and NCs in MLP [calculated from (F), n = 85 cells]. Statistical significance was calculated using Students’ t-test for (A), (B), and (E) and paired t-test for (C), (D), and (G) where *, ∗∗, and ∗∗∗ indicate p ≤ 0.05, p ≤ 0.01, and p ≤ 0.001, respectively.
