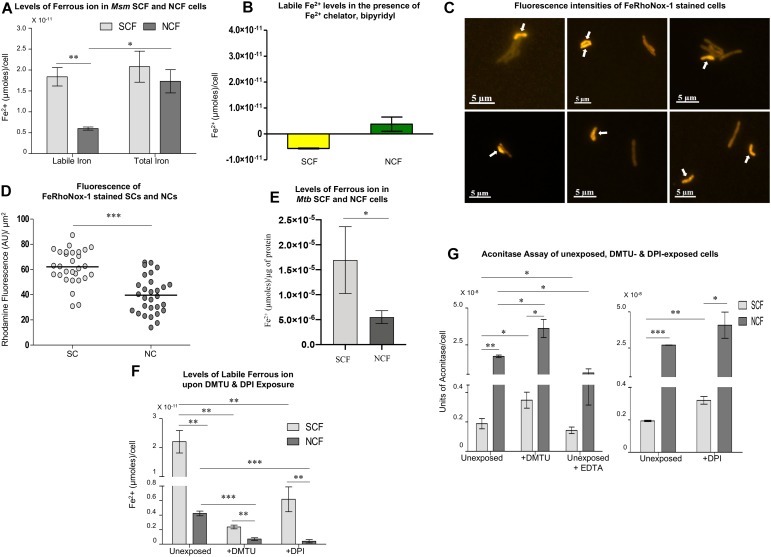
FIGURE 4.
Analysis of iron levels in Msm and Mtb SCF and NCF cells. (A) Estimation of labile and total iron levels (μmoles/cell) in the SCF and NCF cells using FeRhoNox-1 assay (n = 3). (B) Levels of Fe2+ (μmoles/cell) in Msm SCF and NCF cell lysates in the presence of 100 μM bipyridyl (n = 3). (C) Fluorescence microscopy images of FeRhoNox-1 stained MLP cells. Arrows indicate SCs. (D) Single cell analysis of the fluorescence intensities of FeRhoNox-1 stained SCs and NCs [calculated from (C), n = 29 cells]. (E) Estimation of labile iron levels in the Mtb SCF and NCF cells using FeRhoNox-1 assay (n = 3). (F) Estimation of labile iron levels in the unexposed, DMTU-exposed and DPI-exposed Msm SCF, and NCF cells using FeRhoNox-1 assay (n = 3). (G) Determination of aconitase activity in the unexposed, DMTU-exposed and DPI-exposed Msm SCF and NCF cells (n = 3). Statistical significance was calculated using paired t-test for (A), (D), and (G), and Students’ t-test for (E), and (F) where *, ∗∗, ∗∗∗ indicate p ≤ 0.05, p ≤ 0.01, and p ≤ 0.001, respectively.

