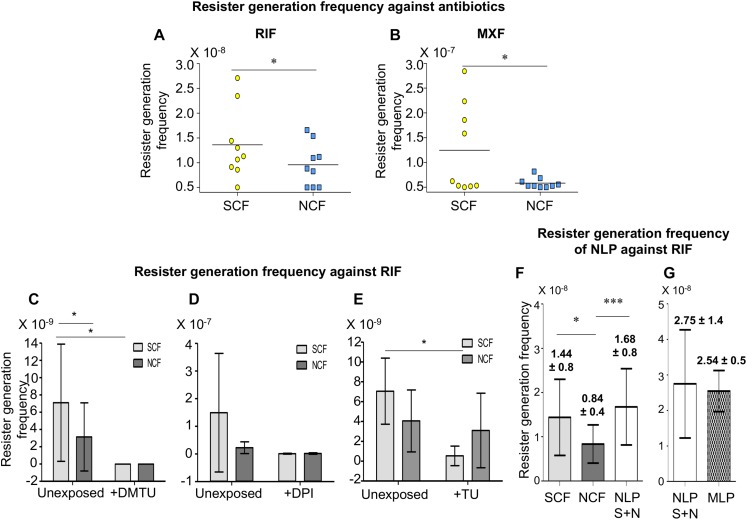
FIGURE 5.
Resister generation frequencies of Msm SCF and NCF cells against antibiotics. (A,B) Resister generation frequencies of SCF and NCF cells when exposed to: (A) RIF and (B) MXF (n = 9 in each case). (C–E) Resister generation frequencies of SCF and NCF cells against RIF when exposed to: (C) DMTU (n = 7); (D) DPI (n = 3); (E) TU (n = 3). (F) Resister generation frequency of SCF, NCF, and NLP against RIF (n = 17). (G) Resister generation frequency of NLP and MLP against RIF (n = 3). S + N represents NLP constituted of unexposed SCF and NCF cells at 1:9 ratio. Statistical significance was calculated using paired t-test, where *, ∗∗∗ indicate p ≤ 0.05, p ≤ 0.001, respectively.

