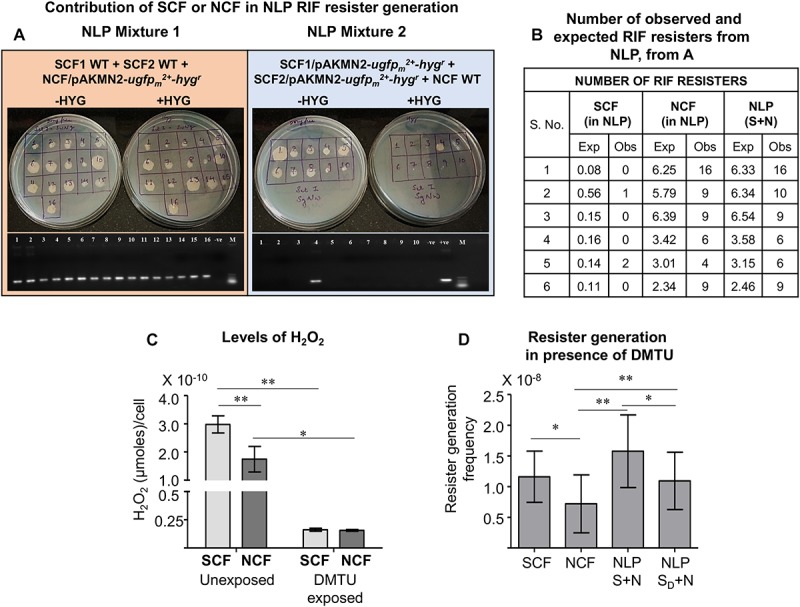
FIGURE 6.

Contribution of the SCF and NCF cell to the RIF resister generation from NLP. (A) Upper panels: Colonies formed from the NLP cross-mixture 1 and 2 constituted with: (left panel) SCF1-WT, SCF2-WT, and NCF/pAKMN2-ugfpm2+-hygr integrant cells (NLP Cross-mixture 1); (right panel) SCF1/pAKMN2-ugfpm2+-hygr, SCF2/pAKMN2-ugfpm2+-hygr, and NCF-WT cells (NLP Cross-mixture 2). Lower panels in (A): PCR amplification products of ugfpm2+ from the genomic DNA of the RIF resisters from the NLP cross mixtures 1 and 2. (B) Table showing the number of observed and expected RIF resisters from the NLP cross-mixtures obtained from (A). (C) Quantitation of H2O2 levels released by the SCF and NCF cells during unexposed and 1 mM DMTU-exposed conditions, measured using Amplex Red assay. Average of technical triplicates are represented in the graph. (D) Resister generation frequency of NCF in the presence of unexposed and DMTU-exposed (represented as subscript D) SCF cells. SD + N indicates NLP mixture comprising of DMTU-exposed SCF cells and unexposed NCF cells at 1:9 ratio (n = 3). Statistical significance was calculated using paired t-test where *, ∗∗ indicates p ≤ 0.05, p ≤ 0.01, respectively.
