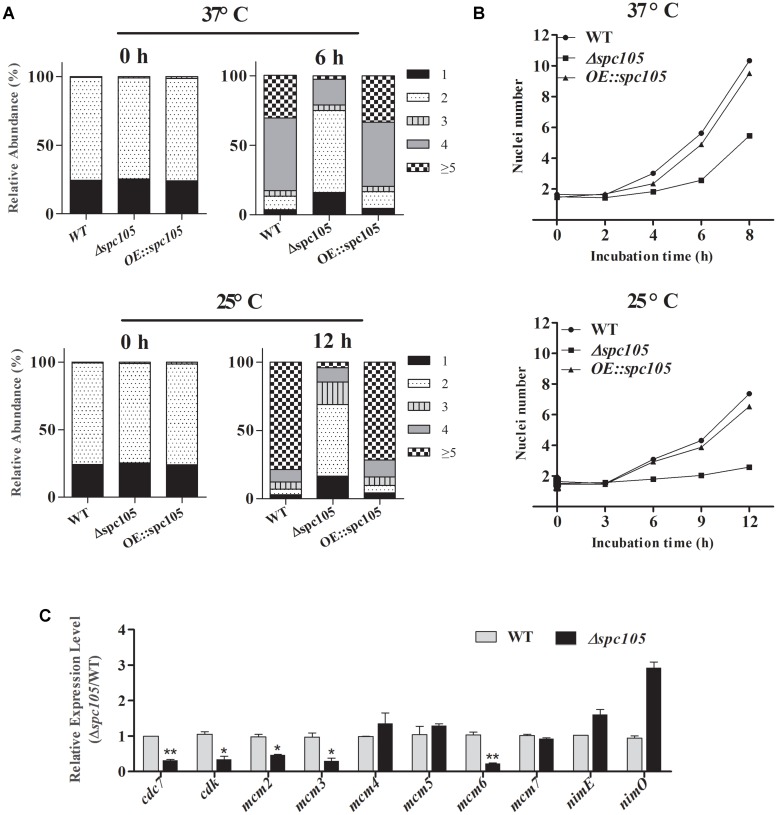
FIGURE 4.
Involvement of Spc105 in the nuclear division of A. flavus. (A) Graphic image of the counted nuclei, the numbers 1, 2, 3, 4, and ≥5 represent the nuclei number. (B) The mean number of nuclei per germling of each strain. (C) qRT-PCR analysis of meiosis-related gene expression. Strains were incubated for 12 h in 100 ml PDB at 25°C and mycelia samples were collected for RNA extraction. Relative expression ratios were calculated relative to the WT control. Error bars represent the standard deviation based on three replicates. *P < 0.05; ∗∗P < 0.01.

