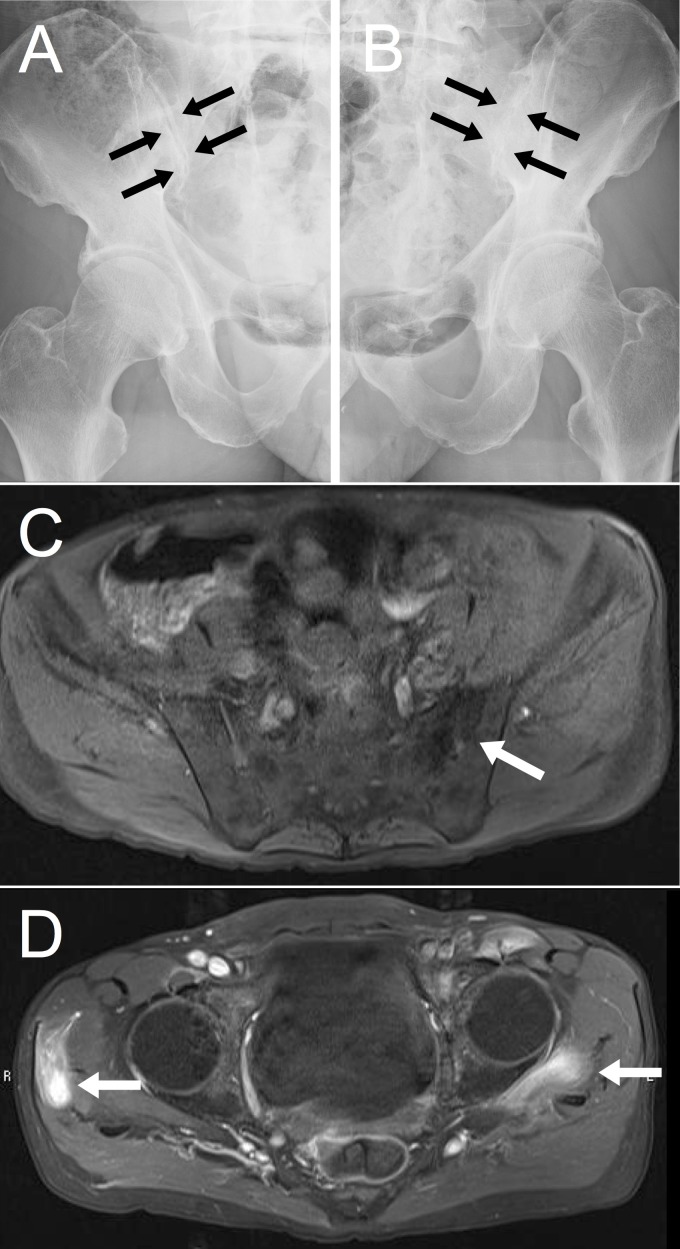
Figure 2.
Radiographs of the sacroiliac joint in oblique view showed sclerosis in the right sacroiliac joint (A, arrows) and ankylosis in the left sacroiliac joint (B, arrows). On pelvic MRI, T1-weighted fat-suppressed images revealed hypointense lesions in the left sacroiliac joint (C, arrow), which were interpreted as ankyloses. T1-weighted fat-suppressed images with gadolinium contrast showed abnormal enhancement in the tendons of the right gluteus medius and left gluteus minimus (D, arrows).

