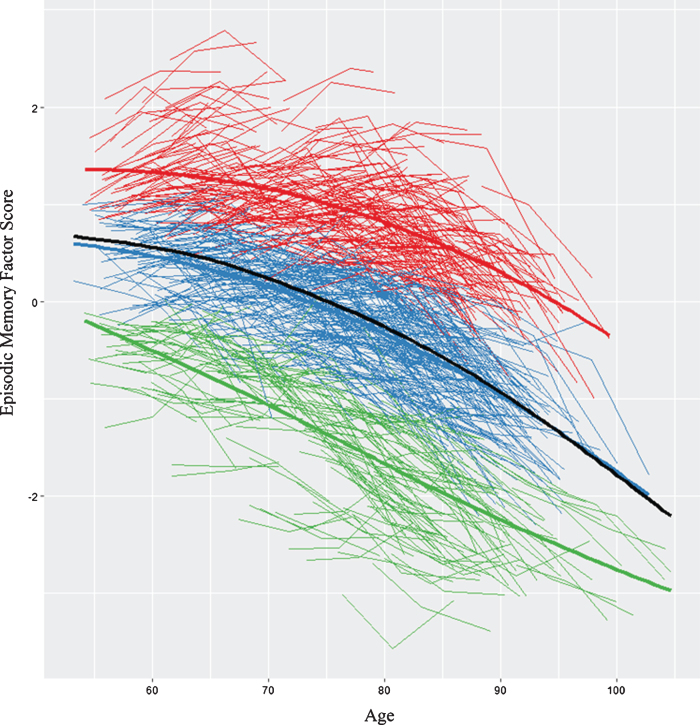
Fig.1.
We identified three memory classes based on episodic memory level and slope. The figure displays the raw trajectory data supplemented by color coding that reflects the three observed classes. Red represents stable memory aging (SMA), blue represents normal memory aging (NMA), and green represents declining memory aging (DMA). In addition, three overall mean trajectory lines (bolded lines) are displayed in the same colors. The black line represents overall latent growth change. The inflection point for the overall sample = 73.4 years (calculated using the “bede” function in R).

