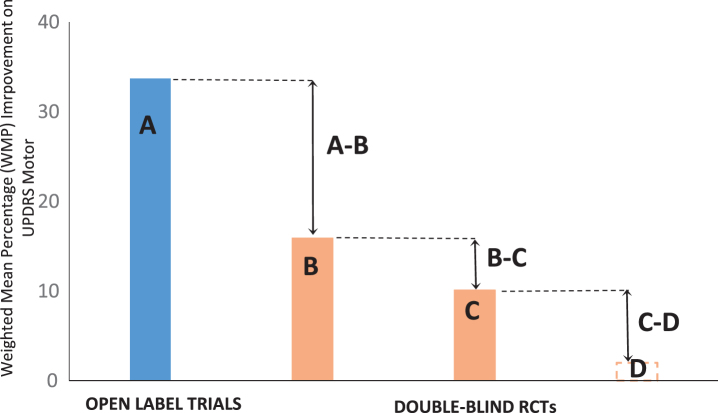
Fig.1.
Overall results for five open label and six double-blind RCTs (Gross et al., 2011 [24]). A) Average score of active groups in open-trials [27– 30, 32]. B) Active groups in SPTs [6, 23, 24, 32– 34]. C) Sham controls in SPTs [6, 23, 24, 32– 34]. D) Unoperated controls (no data). A, B) Difference between the active groups under the two trial conditions. B, C) Estimated effect size in SPTs. C, D) Difference between placebo groups and unoperated controls. WMP, weighted mean percentage.

