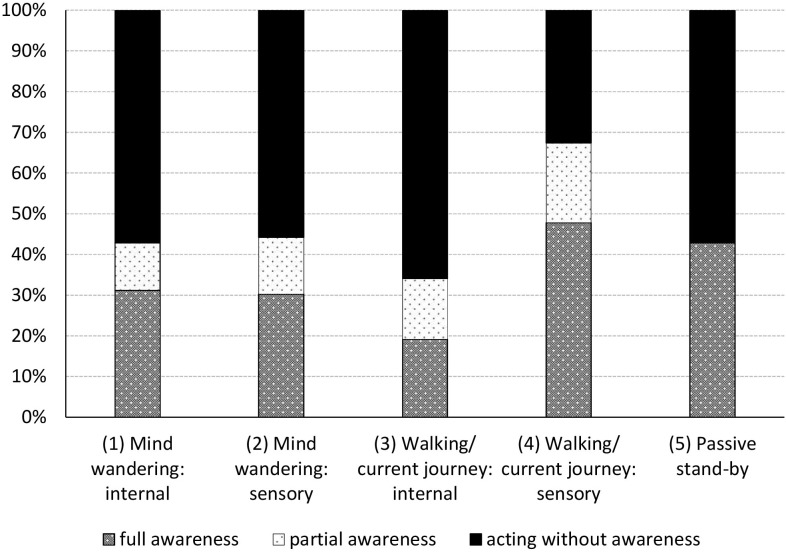
FIGURE 5.
Distribution of participants’ level of awareness for the signboard for each of the five categories of pedestrians’ thoughts (as described in Table 1). Pedestrians’ thoughts differed significantly both for those fully aware (p = 0.043) as well as for the combination of those fully or partially aware of the signboard (p = 0.020).

